Cars:
Reading to date:
At this point you have hopefully read the chapter on Cars from David's book before we start this discussion. This is a quick chapter that models and starts the process we will use to determine our 'typical' personal energy use.
Energy in Gasoline/Diesel:
If we're going to talk about cars as an energy question we have to have a sense of how much energy is in gasoline or diesel. They are a little different but not as much as you might think. Before we just go look it up lets consider the possibility that we could figure this out on our own. Some diesel trucks run on straight vegetable oil (SVO) so it must have roughly the same energy content. We can look at any bottle of oil and see how much energy (in Calories) it has in it. Vegetable oil has about 8 Cal/ml and a density of about .93 g/ml. David uses the caloric value of butter to do the same estimate. On one hand it is valuable practice for us to follow along with David's calculation but on the other hand what we're really going to do if we need this number is look it up via Dr. Google.
Here are the 'official' values from Wiki's Energy Density page.
gasoline: 9.5 kWh/lt, 12.9 kWh/kg, 36 kWh/gal
gasohol: 9.2 kWh/lt, 12.5 kWh/kg, 35 kWh/gal
diesel: 10.7 kWh/lt, 12.7 kWh/kg, 41 kWh/gal
What do you notice about the relative energy available in gasoline vrs diesel?
How far do we drive?
We're already pretty clear about the connection between the distances we drive, fuel efficiency, and our use of energy. We more commonly think about the cost but what we're really buying at the pump is energy.
Activity: As we look to understand how David's analysis for the UK relates to our lives we need to have a sense for how far (on average) we drive and what the fuel efficiency is for our vehicles. In your groups discuss the total number of miles you drive in a year or a week. Find the average distance driven for your group. Do the same for your fuel efficiency.
[save space for our class averages]
David assumes a typical drive in the UK drives about 50 km a day. In your HW problem (below) you will show this is around 30 mi/day and 11 kmi/yr. How does this compare with your expectations?
HW: Cars
David assumes that each person who has a car drives it, on average, 50 km/day. How many miles/day is this and how many miles/yr is this for the whole year? What is the average daily distance you drive (pre-COVID) in km and how many km is this annually?
How do we check this against data? Here are the state by state stats for annual miles driven. What do you notice about this data? Are we dramatically different than the UK? Are you surprised?
Fuel Efficiency:
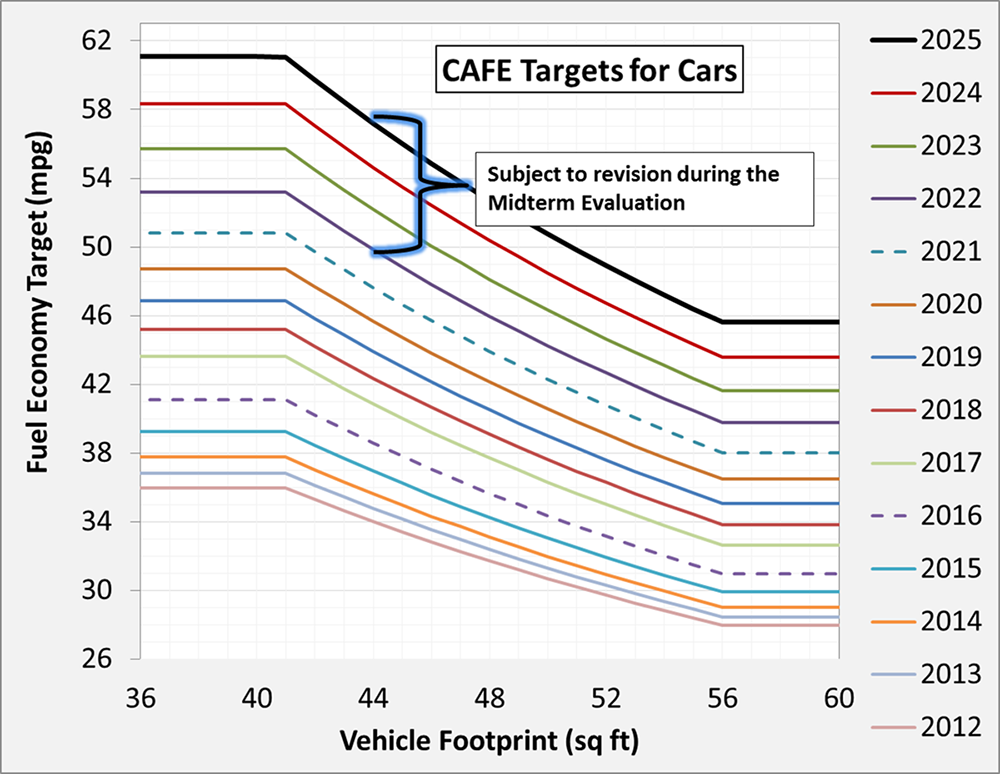
What is a reasonable value to use for fuel efficiency? What are the CAFE standards? Here's a plot of recent history.

What does this suggest we should use for our fuel efficiency?
HW: Cars
In this country we tend to think of the efficiency of a car in terms of mpg (which means miles moved for each gallon of fuel - mi/gal). David bases his calculations on 12 km/liter. How many miles/gallon is this? Another chance to practice unit conversion from previous weeks.
kWh/p/d:
So how do we put all this together to figure out how much energy we use every day (average) as we drive our cars around? Fundamentally it's a unit conversion problem. This video will guide you through calculation using David's numbers.
David arrives at a result of roughly 40 kWh/d/p (40 kWh for each day for each person!) as the daily energy use for an average car owner.
What is different about your personal use? What if your car only gets 20 mi/g - how does that affect your energy use? What if you drive more than 50 km a day?
HW: Cars
Here is a link to the data for a VW Golf TSI. Find the rating for the highway miles/gallon and calculate the kWh/d used by this car if you drive it 50 km a day? You will have to dig through the information on the site to find what you need.
Relevance:
It's all very well to toss numbers around but the question is whether these numbers 'matter' in some sense. Is this a significant chunk of your (or David's) energy use? Go back to the Graphs breadcrumb if you've forgotten from the energy use plot (by country) near the end of the breadcrumb.
US: 250 kWh/p/d; UK 125kWh/p/d
As you can see 40 kWh/d/p is almost 1/3 of the total average daily energy use for folks in the UK. That makes it pretty relevant. Even in this country it represents almost 20% of our individual use. Notice in the Sankey plot for US energy use (below) that Transportation uses about 28% of our total energy. Why the discrepency do you think?

Take Home Message:
Our cars and other forms of transportation are a significant part of our overall energy usage. This means that changing how we get from place to place could have a real impact on overall energy use. The question of how public transport works into this is a topic for our next discussion.
Assignment: HW Cars
Complete and assemble your solutions to all the HW problems (3) listed here showing all the steps in your solutions. Scan to a pdf and turn in on LMS. Please review HW format expectations for guidance about your homework solutions.
Reading Ahead:
Next you will read the chapter on Cars: Tech from David's book before we start the next discussion. This is a quick chapter that lays out the broad structure of the text and explains the core unit we will use to discuss energy use.
