Personal Wind Energy Calculations:
Reading a Wind Rose:
A wind rose is a way of representing the speed and direction of the wind at a given location. The data for this calculation comes from this data source for the State of Oregon. We are going to consider the data for April as an example of a month we expect to be windy. Here's the actual wind rose.
Each bar represents wind blowing from a particular direction. The length of each part of the bar represents what % of the month the wind blew that speed from that direction. Collectively they should add up to 100% except for what are called 'calm winds' that are too slow to register.
Notice that the dotted lines are labelled 3%, 6%, 9%, etc etc. These are percentages of the month that the wind blows that speed. We can take a typical month to be 720 hrs (30 days).
Looking at the bar that points south we see yellow, red, and blue sections. The yellow extends from 0 to about 4%, the red from 4% to 6%, and the blue from 6% to maybe 7%. This is a form of a stacked plot.
Total Time Wind Blows:
If I add up the length of each bar I should get the total time the wind blows in April. Starting at the south here are my quick estimates of the lengths of each bar.
7, 8, 5, 3, 2, 1, 2, 2, 4, 8, 13, 13, 6, 3, 4, 6 add up to give 87% => 13% time no wind blows (12.6% on plot)
Total Percent in Each Speed Range:
So I can do the same thing in each speed range. We will skip the lowest speed range because the cut off speed for most wind turbines is greater than 3.3 m/s.
3.3 - 5.4 m/s: Average speed = 4.5 m/s
2, 2, 1, .5, .5, .5, .5, 1, 2, 4, 5, 4, 2, 1, 1, 2 = 29%
29% of 720 hrs = 209 hrs
5.4 - 8.5 m/s Average speed = 7 m/s
(in each quadrant) 2, 1, 11, 5 = 19%
19% of 720 hrs = 137 hrs
8.5 - 11 m/s: Average speed = 9.5 m/s
(in each quadrant) 0, 0, 2, 1 = 3%
3% of 720 hrs = 22 hrs
Power Output for Aeolus 500W:
Below is the power curve for a modest wind turbine that you might purchase to put in your back yard. Ones like this are available for around $250 these days. We need to identify the power output at each of the average wind speeds identified above.
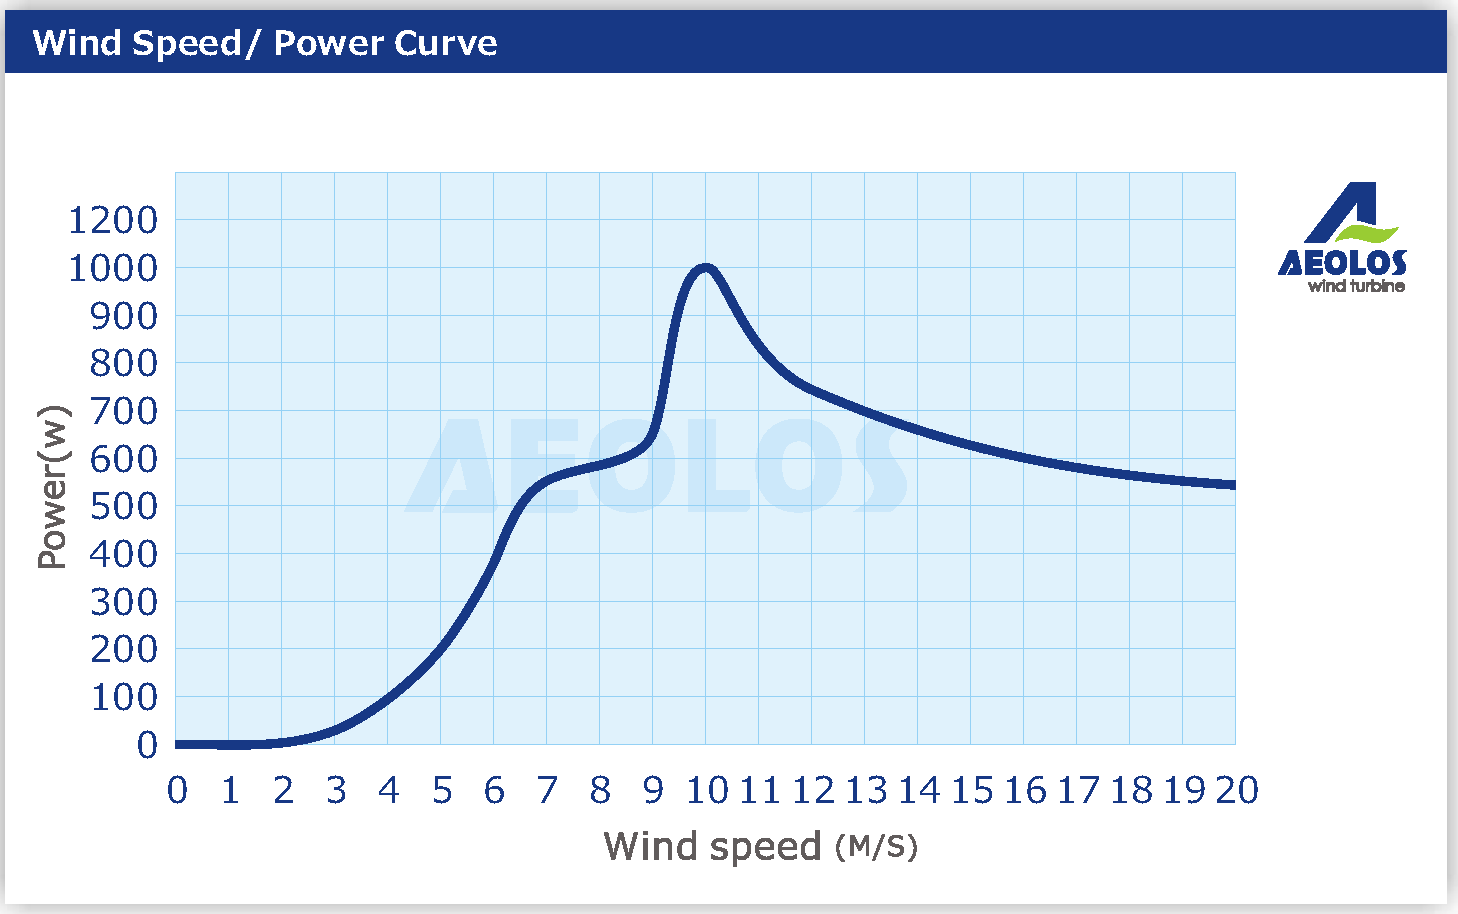
At 4.5 m/s: Output is 150 W
At 7 m/s: Output is 550 W
At 9.5 m/s: Output is 1000 W
This power curve has a different shape than the one we looked at previously in that it has a peak at around 10 m/s and then drops back to about 500 W at higher speeds as it throttles it's behavior to prevent damage to the wind turbine.
Energy Generation:
Energy = Power * Time (kWh = kW*h)
At 4.5 m/s: Energy = 150 W * 209 hr = 31 kWh
At 7 m/s: Energy = 550 W * 137 hr = 75 kWh
At 9.5 m/s: Energy = 1 kW * 22 hr = 22 kWh
Total Energy Generated in the Month: 128 kWh
Things to Notice:
Notice that 60% of the energy generated takes place over just 6 days (137 hrs) and just 1 additional day (22 hrs) generates another 15% of the energy. You could turn your wind turbine 'off' for 3 of the 4 weeks of the month will little loss of energy generated. These small wind turbines can be a bit noisy so turning it off might keep your neighbors from being quite so irritated.
Value of Energy Generated:
The value of the energy generated (for you as a retail customer ) is $0.10/kWh. This means April generates about $13 of energy savings for you. Over 12 months (if they were the same) this would be around $150/yr.
Payback Time:
If such a system costs $250 your payback time is less than 2 years which is quite good. A few years ago this system was about $1000 which made for a 7 year payback time which was still good. Even if you turned your wind turbine off during most of the month you would still expect to recover your costs in less than 3 years. Good deal!
Yes but......
Yes, there are other considerations that might add to your costs and increase your payback time. On the other hand, if you're living off the grid this is a very cost effective way of creating modest amounts of energy from the wind. What we're illustrating here is the sort of calculation that wind farm developers make when deciding whether to invest in a particular location.
