Purpose: Checking Reality
The purpose of this lab is to explore the question of how we check the validity of an idea that we have. In this particular case we will use a seemingly simple example of cooling cups of hot water to explore whether things work out quite the way we think. The context for this exploration is our discussions about how heat (energy) moves out of our houses which is one of the more significant forms of energy use for people in the first world.
Equipment:
To complete this lab independently you will need a 'coffee' mug (ceramic) and a rinsed out 'tin' can that is about the same size and shape. Two of each would be great and some corrugated cardboard (box) to make lids for some of them. The equivalence doesn't need to be exact. NOT a Hydroflask:). Ideally you will also find a thermometer of some kind. In many kitchens people have cooking thermometer that looks something this.
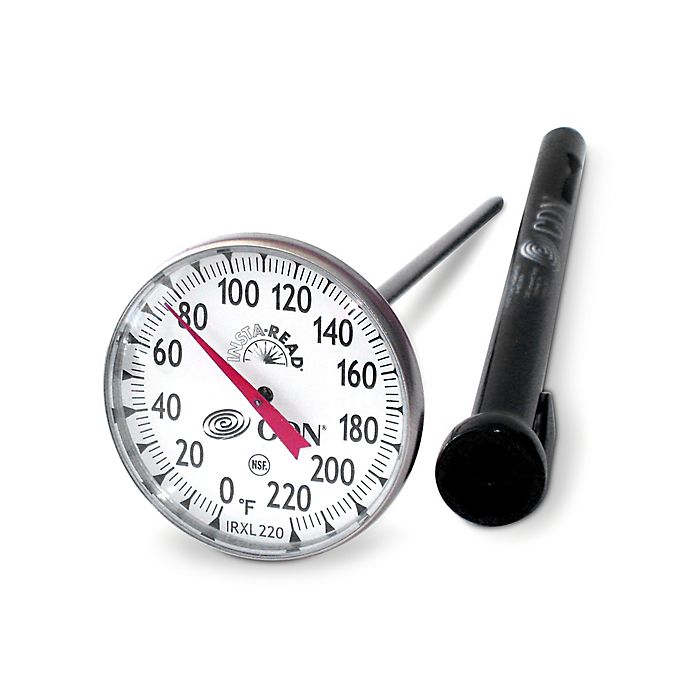
You want the temperature range to go from around 0 to around 100 C (30 to 200 F) if possible. The ones that only go between 130 F and 180 F won't be much help. Digital ones will work well. Thermometers for measuring body temperature will NOT work. If you don't have one and can't borrow one you will do this lab in a little bit more rough and ready way. At some point in your life you will want one of these to check the temperature of various things in your kitchen and they run $10-$15 on Amazon and about the same in local stores. Do NOT get the candy thermometer which has a very different purpose.
Procedure:
Depending on the year your instructor will have a variety of different cups. The options may include metal cups, styrofoam, ceramic, glass, plastic, and paper. The starting point for the discussion will be to explore what we expect to see if we fill some of them with hot water and watch (with a thermometer) it cool.
For a presentation of the thermal conductivity equation and the meaning of the various terms in the equation please see the Conductivity Lab Resource page.
0) Expectation: Mostly folks would correctly expect the metal can to cool off faster than the ceramic mug all other things being equal. What we want to do in this lab is test that idea a little bit to see if the situation is as simple as it seems.
I) Controlling for variation: In any experimental test of an idea it is generally important, if possible, to minimize as many differences as possible except for the one we hope to test. For those of you with a philosophic bent this is a form of reductionist thinking -- the idea that you reduce any complex system to a set of singular variables that can be tested individually. The hope, not always true, is that the individual behaviors can be recombined to describe the more complex system. We will discuss what variables we can control and which ones we are trying to test. A discussion of the choices we made about setting up the experiment will be the first part of your lab write up. Here are some things I hope you will think about:
- how do I know that data from other groups can be compared to mine?
- how do I know whether the starting temperature changes things?
- do I need to worry about how much water is in each cup?
- is a lid important? should we do them all without lids?
- does stirring or blowing on the cups affect the outcome?
If you are doing this lab independently you will need two mugs and two metal cans. For one of the mugs and one of the cans cut pieces of corrugated cardboard to form lids. A double stack would be even better!
II) Doing the experiment: Once we have decided how much we will attempt to control the experiment we will set it up and measure the temperature of the water in the cup for about an hour. Your task is to record the data so you can include it in your lab report and use it in the calculations you will be doing in the next part. This data will be a temperature for each type of container and an elapsed time at reasonably regular intervals (why is this useful? - is it critical?). Because there is a worry that the process of measuring the temperature might disrupt the experiment only measure every 5-10 min. You should get around 10 temperature measurements over the hour. When we do this in class we sometimes gather data for shorter times because we have more consistent equipment.
Commentary: A consistent source of hot water is certainly helpful. If you have an electric tea kettle that works well (that's what we use in lab). Hot water from the tap will also work. To try to get the starting temperatures all the same fill all 4 containers to near the top with your hot water and let them sit for a couple of minutes. Then pour out the hot water and refill to a little below the top with fresh hot water. This minimizes the effect of heating up the cup/can which tends to change the starting temperature. After you refill the cups check the temperature of each one, record the temperature and the time, and then cover one mug and one can with the corrugated cardboard lids. Keep track so that later you always cover the same cup and can.
No Thermometer: If you are unable to find or borrow a thermometer you will need to make cruder temperature measurements using your finger and the 'yikes' to 'aahhh' to 'huh' scale. 'Yikes' too hot to leave your finger in, 'aaahhh' is hot but manageble, and 'huh' is lukewarm. I know these are very subjective but here's what you can do to help. As you make a set of measurements compare your four containers. Are they about the same or is the uncovered one hotter than the other? Do they feel almost the same or can you tell they are different. This is not the most desireable way to do this lab but I'm not making you buy a thermometer just for this lab.
III) Plot Data: You have data from 4 different mugs, two with lids and two without. Plot all 4 sets of data on a graph that shows time along the horizontal axis and temperature along the vertical axis. If your thermometer measures temperature in F (Farhenheit) you may leave it in those units. In a f2f class we will plot Centigrade (C). To make the data changes more visible do NOT start your temperature scale at 0. Start the bottom of your vertical axis a few degrees below the lowest temperature you measured. If you are using your finger to measure temperature label your vertical axis in equal units going from cool to 'yikes'. Remember - DO NOT CONNECT THE DATA POINTS!
III) Analysis: Based on your data and our discussion of the thermal conductivity equation What does your data tell you about the thermal conductivity of the various cups? Which has a higher thermal conductivity? Explain why the data supports your assertion. What other information can you extract from the overall data? What is the difference between the mugs/cans with lids and without? Are you surprised by similarities or differences between the metal containers and the mugs. What can you say and, most importantly, why?
IV) Interpretation: The question now is "What does this mean?". We will have discussed the results in class, unless we ran out of time, but I am looking to see if you can articulate what the numbers suggest about the behavior of the mugs as they cooled down and what was, or wasn't, surprising. Discuss what this experiment has to say about keeping your morning hot beverage hot while you slowly drink it over an hour? Offer your explanation for the behavior we observed and how you would explain it to someone who isn't in this class.
Resources:
Table of coefficients of thermal conductivity (k)
Table of U values for building components: Note that in this table are some metric R values where R=1/U.
LAB DELIVERABLES (LMS Assignment):
I) Include the usual header information for your lab report - name, date, lab name etc etc.
II) Initial Explanation: In a paragraph or two explain what we hope to understand better after this experiment. Why did we put lids on some of the containers? Why have two different types of containers of different materials that are roughly the same size.
III) Data: Present all of your data for the four container is a clear and coherent table with appropriate labels.
IV) Plot: Present your plot of the data showing all four containers on the same plot. Make thoughtful choices about symbols and scales to make your plot as useful as possible. Check the suggestions in the lab.
V) Analysis: What does the plot tell you about the thermal conductivity of the different containers and the effect of the lids? What expected and unexpected features does the data show? Which containers cooled quicker and by how much?.
VI) Interpretation: What do you think this all means?
