Purpose:
The purpose of this lab is to explore forces and how we construct meaning from a plot of data. The measurements we make will also be relevant to the concept of rolling resistance in cars.
Equipment:
To complete this lab independently you will need a rubber band of modest length (at least 10 cm (4 inches) long and 2 or 3 would be great!), a couple of paperclips, a small ziploc bag or envelope, and a good stack of small identical objects like quarters or 16d nails or large washers to use as weights. You will also need some form of linear measuring device that will depend on what you find for a rubber band. Since we are going to measure how the 'rubber band' stretches it would probably be ideal to have a ruler that measures mm. Many of the standard rulers have inches on one edge and cm and mm on the other edge.
Procedure:
The core point of this lab is to understand how data allows us to build models of the relationship between different quantities. In this case we will be exploring how a rubber band stretches under load.
The experiment itself is fairly simple though it may take some trial and error to get it set up. One end of the rubber band will be placed over a hook to support it. That hook could be a picture hook or a nail in a post or any other rigid attachment point that won't break during the test. To check the strength place the rubber hand over the stretch it to 2 or 3 times its original length. If the hook holds you are good. Use a paperclip or other device to attach a light bag or envelope to the other end of the rubber band. This bag will hold your 'weights' but should be light enough that it doesn't really stretch the rubber band when it is empty. If you have multiple rubber bands you can certainly link two or three of them together to get a longer one. It will make some of the measurements easier if you do.
-
I) Setting Sketch: In physics, a picture which illustrates the experimental setting is a basic expectation. The detail doesn't need to be great nor does the quality of the artwork need to be museum quality. The goal is to communicate your set up and indicate where you made your measurements. That's a why a picture is less useful because it's hard to 'draw' on successfully.
- II) Initial Verification: Before we dive into the actual measurements it is important to check that your experimental setup and weights will do what we need. Start by measuring the length of your rubber band. Then see if you have enough weights to stretch it until it is between 150% and 200% of its initial length. This also verifies that your bag or hook won't break (probably) during the experiment. The idea is that even if the weights were to fall on someone they aren't heavy enough to do damage. If you are working with heavier weights please make sure that small creatures of all kinds are kept out of the experiment area.
- III) Data: Once you have verified that the experimental setup then you can start taking data. Measure the length of the rubber band with only the bag attached. Then add 1 or 2 weights and measure the length again. Make a table of this data that has a column for the number of weights and a column for the length of the rubber band. This table should be created in your word processing program not by hand. Add weights until the rubber band has stretched to 2x it's original length (or 1.5x if that's what you could get). Then slowly remove the weights reversing the process and measuring the length of the rubber band 'on the way up'. This will be another column in your data table. Repeat this entire process. I am expecting 6-10 data points going each way for a total of 24 - 40 total data points.
- III) Plotting: Now you have multiple sets of data points that come in pairs (x,y pairs if you were in math class). Each total number of weights has 4 lengths associated with it. For now calculate the average length of the rubber band for each set of weights (a new table with appropriately labeled columns). Plot these data pairs on an x-y graph as you have in math class. Use the vertical axis for the number of weights and the horizontal axis for the length of the rubber band. Please note that the first data point will be the length of the rubber band with no weights (just the bag). Be sure to indicate the units of length that you used.
- IV) Sloping: A core idea in science and math is that the slope of a plot allows us to predict what the plot will do at some other point on the graph. The slope is a description of how the “y” variable changes as you change the “x” variable. This is why it is often described as the rate of change of “y” relative to “x”. You may have learned about slope as “rise over run”. Find the slope of the data for your rubber band. Start by making a copy of your plot and then draw a trend line which is a reasonable representation of your data (as we did in class). Using the same techniques we did in class determine the rise and run. Be careful -- the slope is NOT the y value divided by the x value of a data point. That is an unfortunate misunderstanding that comes from math class examples. The rise will be in units of your weights and the run will be in the units of your length measurement. The slope you calculate tells us something about the stretchiness of your rubber band.
-
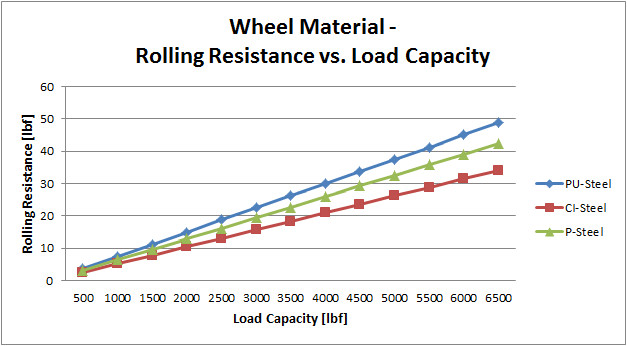
V) Application: Let's apply this idea of the slope as a description of the relationship between two variables to a characteristic of our cars. Much like the relationship between the weight and the stretch of the rubber band there is a relationship between the weight or load of a car and the resistive force generated as it rolls. You particularly notice this if you try to ride a bike with low tire pressure. The plot below show some data for different castors rolling on steel. The slope of this curve is called the coefficient of rolling resistance. Determine the slope of the PU-steel data including the units. Calculate the rolling resistance in (lbf) when the load is 8000 lbf. We will talk more about this in class.
Commentary: When you make your measurements I'm looking for reasonable accuracy but not excessive accuracy. If we were in class together I could notice and talk to folks who are being overly concerned with accuracy. In the time of COVID all I can do is offer general guidance from a distance. If it takes you more than a minute or so to add the weights and measure the rubber band you may want to relax a little. There is a time and place for high precision but this is not it.
Commentary: Plotting in this class is best done by hand on graph paper. A pdf file for graph paper is linked at the end of this paragraph. If you don't have access to a printer you can get a pad of graph paper at any office supply store. Draw your axes labels clearly and plot your points so the data can be seen. Do not be surprised if you end up doing the plot more than once to get it so it looks reasonable. What I expect is that your data points will form a relatively straight line though there may be some scatter in the data. That's how mine looks. If a particular data point looks way out of whack you might want to check it. Do NOT connect your data points with lines as you might do in math class. The data points are what we are interested in.(graph paper).
LAB DELIVERABLES: (Turn in on Bb)
I) Include your clear and labeled sketch at the beginning of your lab report. Describe and illustrate what measurements you made so it is clear what your data means.
II) Present your data table for the length of the rubber band as it depends on the weights it was supporting. This will be a table with at least 5 columns for the weights and each of the sets of length data described above.
III) Present another table showing the average length of the rubber band for each weight that you used to create the requested plot. Present your plot as part of your lab report. Your plot should have clear labels on the axes with units along with well defined data point. Do NOT connect the data points with lines.
IV) Present a copy of your data plot showing the trend line that you drew that describes the apparent trend of the data. Show your calculations, and how your numbers were generated from the plot, for the slope of that trend line and indicate the units of your result.
V) Calculate the Coefficient of Rolling Resistance from the data plot provided showing your process clearly. Be sure your result has the appropriate units.
