Purpose:
The purpose of this lab is to explore solar cells how their performance depends on how they are oriented and what the sun is doing. The various activities for this lab will build on resources found on the pveducation website created by Stuart Bowden and Christiana Honsberg at Arizona State University. This website is quite extensive so I will try to link you directly to the parts of it that are needed for this lab. If you are interested in solar cells and solar panels more generally there is a great deal you can learn from exploring this rich resource.
Equipment:
NO equipment is needed for this lab. All results will be from various simulators.
Procedure:
The following are the steps we will take:
-
I) Where are we?
The interactive tools that we will use will require that we know where we are on the planet and where we are during the year. Using your favorite web resource find the following information.
Location: What is the latitude and longitude for Central Oregon in degrees N,S,E,W (no precision needed)
Day of Year: If Jan 1 is day 1 and we count through the year to 365 what is the day number of the first day of each month.
Time Zones: Some of the tools will need to know the time of day which will be determined relative to Universal Time as measured in Greenwich England. If it's 14:00 in Greenwich what time is it here? How many hours different?
-
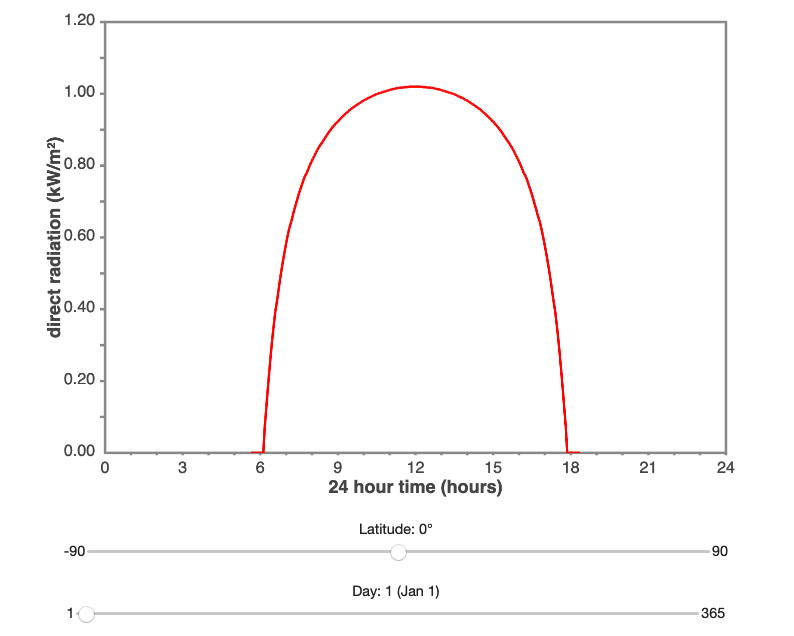
II) Sunlight Available: Insolation Tool: There are three tools we are going to use on this page. The first allows us to determine how much energy is arriving at our location on the earth at different times of the year. The units are kW/m2. A typical solar panel is about 1.5 m2. Using the first tool determine the direct radiation from the sun arriving at the ground at 9 am, 12 pm, and 8 pm on each solstice and equinox (4 days during the year) Calculate the % change from 9 am to noon on each of those days. What do you think this says about the availability of solar energy at each of these points during the year?

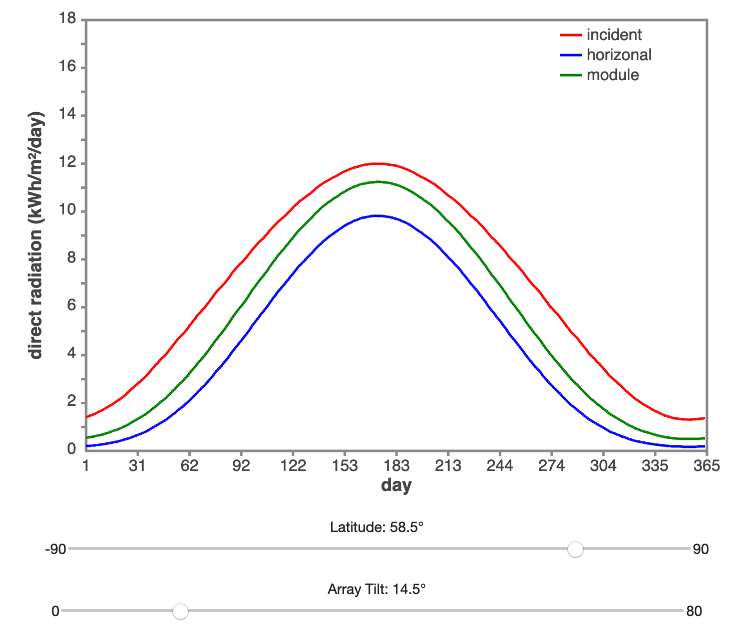
III) Energy Available: The second tool shows how much energy is actually available through the day (kWh/m2). A solar panel which is constantly adjusted to point directly at the sun will give the energy indicated by the red line. Such tracking systems are complex and prone to mechanical problems. If you merely lay the solar panel flat on the ground you will get the energy represented by the blue line. Placing the panel at a fixed tilt is more reliable than tracking though you get a little less energy overall. Notice that if you tilt the panel at 0o the green line is directly on top of the blue line as it should be. Play with the tilt of the panel until you feel like it is as close to the red line as possible. What you are working to do is get as much area underneath the green line as possible. You will see that are some competing factors taking place as you raise the tilt of the panel. What is the tilt angle that you believe gives the best results for us here in Central Oreon?

-
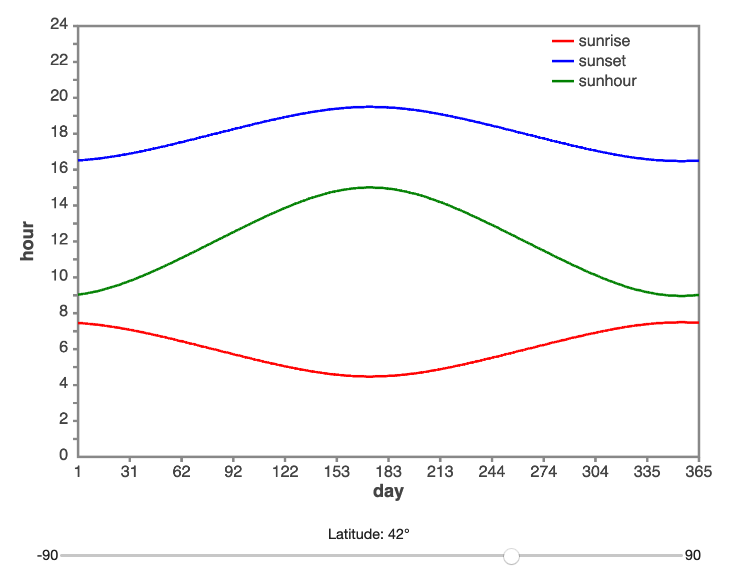
IV) Daylight: The last tool on this page shows the amount of daylight at different times of year. Set the latitude for Central Oregon and compare the longest day of the year to the shortest. The green line shows the total number of hours between sunrise (red) and sunset (blue) for each day. For fun you might look at a place like northen Alaska where the latitude is 70o. How much more (in %) daylight do we get on the summer solstice compared to the winter solstice?

V) Shading: Shading Tool: On this page you can drag a piece of 'cloth' to cover part of a single solar cell. Pmp is the power generated by the cell (notice the units of W). You can estimate the power visually by looking at the area under the red line which is basically a rectangle. In this simulation does it matter how you cover 1/2 of the cell (top, right, from the corner)? In real life covering it in different directions often matters. The second simulation on this page shows a chain of solar cells as they are configured in an actual solar panel. What happens to the total power produced (the area under the blue line) as you shade just one of the 10 cells? This is why even a little bit of shade on your roof panels (or a leaf covering part of a panel) can dramatically reduce the output of the array.
-
VI) Module Layout: Layout Tool: On this page they describe the typical layout of a residential solar panel. It has 36 cells connected in a single chain. There are other ways we could connect the 36 cells (6 chains of 6, 4 chains of 9, etc etc). Using what you learned in the previous step about shading find the optimum arrangement that minimizes the power loss when one cell is shaded. Remember that the power generated is the area under the red line which you can quickly calculate. In the original setup (1 long chain of 36 cells) 100% of the power goes away if one cell is shaded. In 2 chains of 18 half the power is lost if one cell is shaded. What changes about the characteristics of the solar panel as you have more shorter chains?
-
VII) Analysis (What did you learn?): Now you've spent some time exploring some characteristics of solar cell systems. What are two things that you have learned about solar cells that you will remember in future conversations about PV systems?
LAB DELIVERABLES (turn in):
Turn in your answers along with a description of how you arrived at your answer. In some cases you are asked to explore options. Describe what options you explored and why you landed on your choice. Screen shots would be very appropriate and helpful in several cases.
