The Problem:

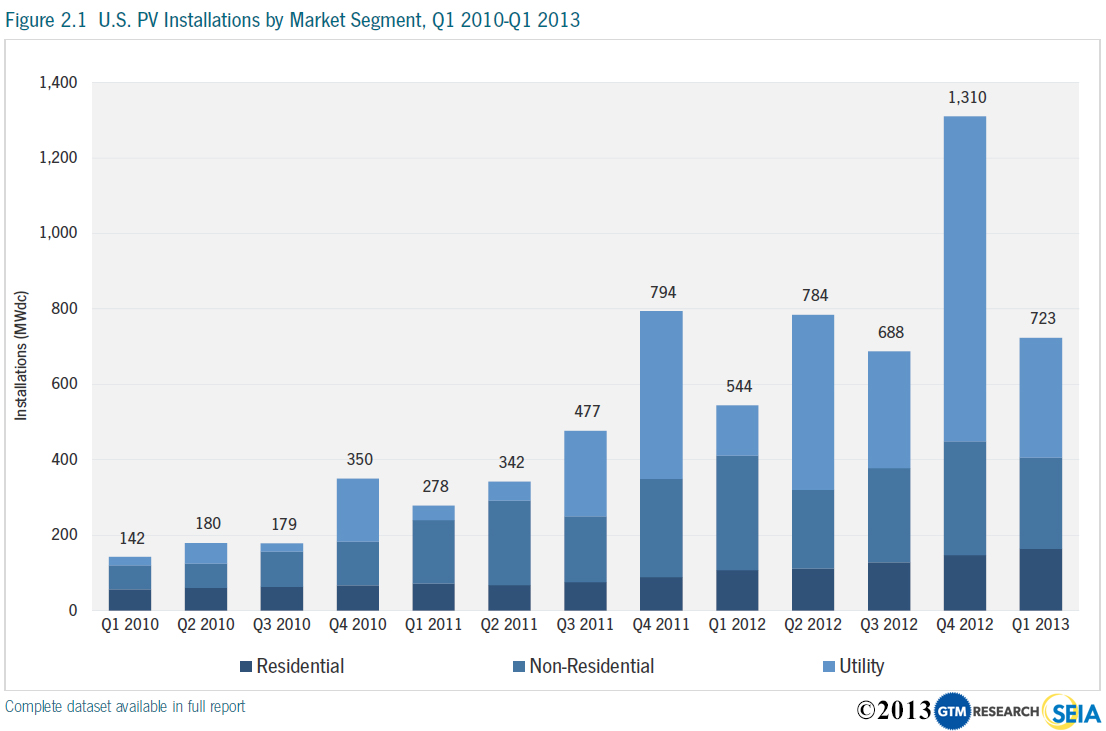
Here are some questions about this plot:
- Are the axes linear or logarithmic?
- What are the units describing each axis?
- How much non-residential capacity was installed during the 3rd quarter of 2012?
- Which of the three types of PV installations has been growing steadily over the time plotted?
- What is a reasonable estimate of total residential capacity install through all of 2011?
- What is the pattern in the installation of Utility scale solar capacity? -- why do you think this is?
- What is the rate of growth of residential capacity during the year of 2012?
