Graphs and Motivation
In the first chapter we spent time discussing various aspects of graphs and plots. We talked about looking first at the labels on the axes to understand what information was being presented. We explored the important differences between linear scales and log (logarithmic) ccales. We also noted that on every plot it is important to consider the meaning of the slope of the data and/or the area under (or within) the plot. Sometimes only one of these features is meaningful and sometimes both, it just depends on the plot. Finally we talked about the meaning of averages and why they are useful and how they can sometimes hide important ideas. These problems will ask you to apply these understandings to graphs in the first chapter as well as some other graphs I give you.
1) Consider the following plot of oil production from US sources
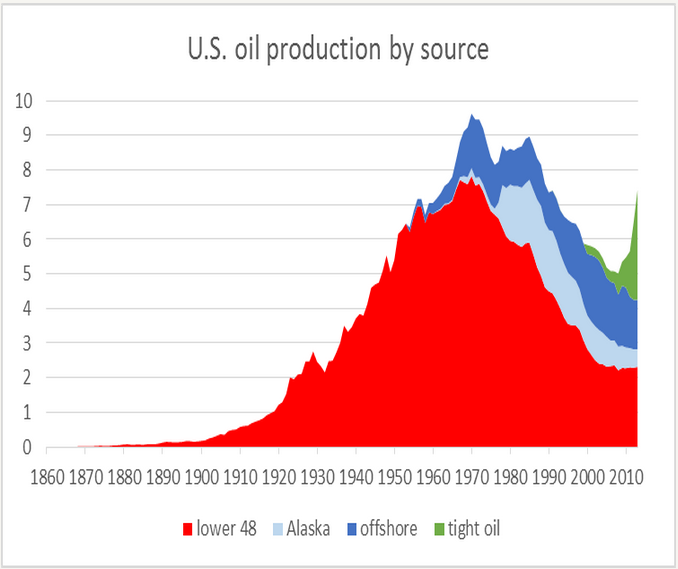
Figure 1 The chart produced by James Hamilton [3] shows crude oil production in the USA according to area and type in million of barrels per day. The long-term decline following the 1970 peak was interrupted by the addition of Alaska in the 1980s. More recently the addition of tight oil (shale oil) has had a spectacular impact. This chart based on EIA data is showing crude oil only.
- What are the units (dimensions) that are being used on each axis?
- What is the highest annual volume of oil produced by the US during the time shown on the graph?
- What is the highest annual volume of oil produced by Alska? Be careful when you look at the graph, it's a little tricky.
- What year is the highest production for Alaska?
2) Consider the following plot of the cost of memory for our computers and other digital technology.
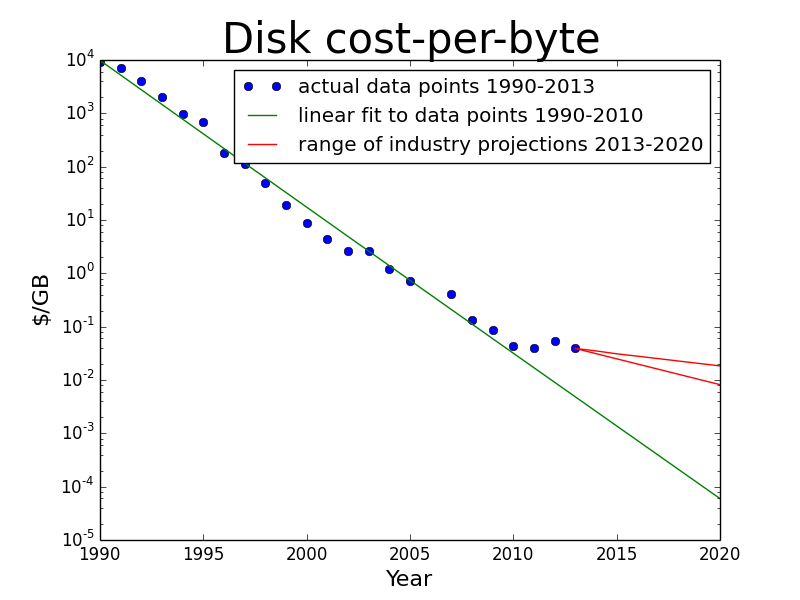
- What are the units (dimensions) that are being used on each axis?
- Are the scales linear or logarithmic? Which?
- Is the cost/GB rising or falling?
- What was the cost of for 10 GB of disk memory in 1995? ....and in 2010? You will need to do more than just read a number off the graph to answer these.
- What important difference does this graph indicate between the costs before 2010 and those after 2010?
3) Here's another graph that is related to what we will be looking at this term.
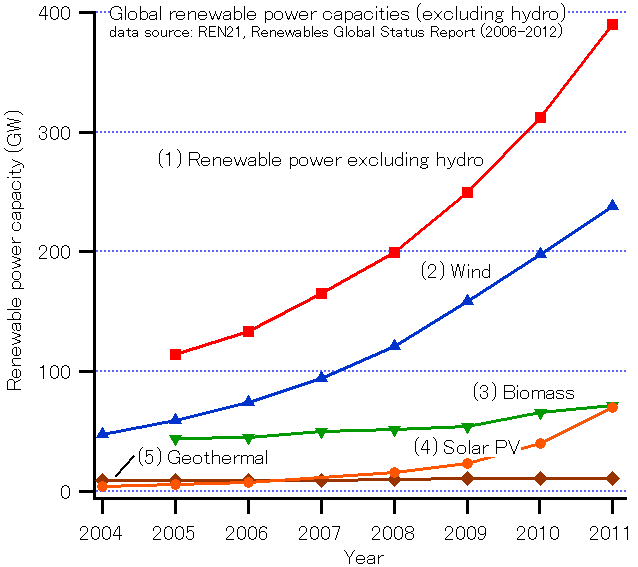
- What are the units (dimensions) that are being used on each axis?
- Are the scales linear or logarithmic? Which?
- Is the production of energy by renewable sources rising or falling?
- When did we hit 200 GW of renewable energy production?
- What is the rate of growth of renewable energy production between 2009 and 2011?
- What does this growth rate suggest our power production capacity will be in 2020?
Now for some unit conversion problems.
4) Assuming that you work 40 hrs a week for 50 weeks a year show how much more money you make in a year IF your hourly rate goes up by $1.00. This is almost the same as the problem we did in class and the best value for you is to go through the whole calculation to be sure you understand it.
5) Convert 65 miles/hour to m/s (meters/second). You know that the answer is roughly 30 m/s but do it slightly more carefully and see what you get. You will probably need to know that 1 mi = 1.6 km but all the rest of the conversion factors are ones you know. To get the most out of this problem set it up just like we did in class.
For the next two problems you will need this recipe.....
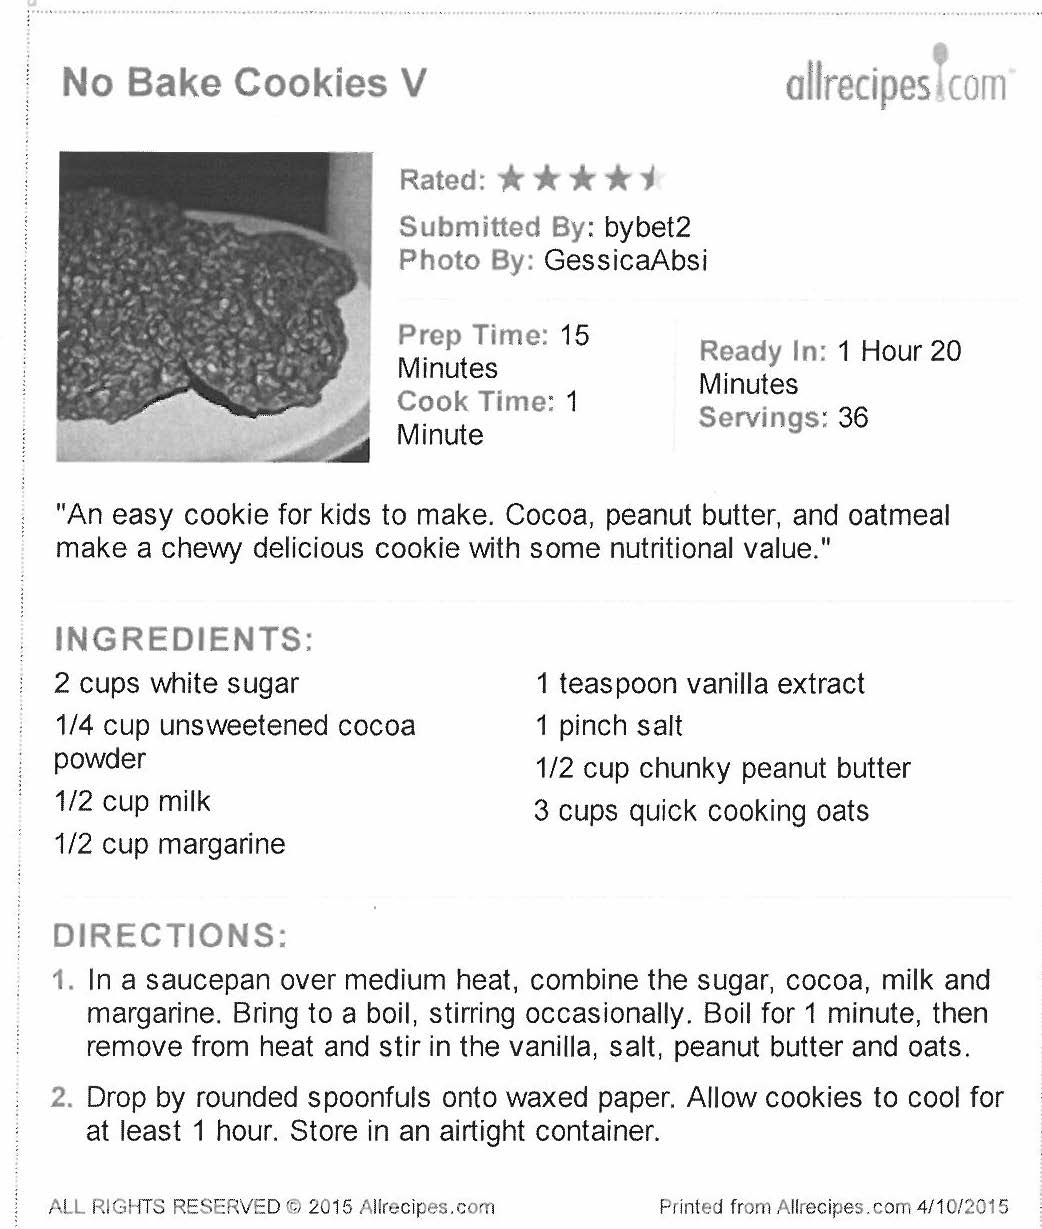
6) There are two conversion steps we talked about for recipes and there are two different ways to do it. What you will do this time is convert the US volume measurement into a metric volume measurement (ml = milliliters = cubic cm = cc). In the next problem we will convert the volumes to masses using the idea of density. For this problem you will need to know that 1 fluid oz (US) = 29.6 ml and that 1 oz = 6 teaspoons. Convert all 7 recipe items into ml. No need to convert a pinch US to a pinch European -- they're about the same:)
7) Now convert the volumes you got in problem 6 to grams. To do this you need to know the density of each material and that the mass (weight) = density x volume. The density of each ingredient is given below.
- sugar: 0.85gr/ml
- milk: 1.0 gr/ml
- butter: 0.96 gr/ml
- cocoa powder: 0.34 gr/ml
- vanilla extract: 1.0 gr/ml
- chunky peanut butter: 1.09 gr/ml
- oatmeal: 0.66 gr/ml
Feel free to try the recipe, I'm told it's good.
