Position and Velocity
This week we spent time learning how to apply our plot/graph reading skills to plots of position vrs time and velocity vrs time. We also explored the relationship between them and their ability to allow us to predict future position and speed. Here are some problems to help you practice those skills. In each of these plots we will assume that "forward" is positive (+) and "backward" is negative (-). For all the velocity plots you may assume that the object is initially at +1 m.
1) Consider the following plot ....
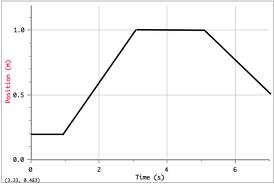
- Write a brief verbal description of what the object is doing.
- Is this object ever sitting still? If so during what intervals or at what moments?
- When is it going "forward" (+) and when is it going "backwards" (-)
- What is the fastest it is going (calculate from plot)?
- Sketch a velocity vrs time plot that tells the same story - does NOT need to be numerically exact!
2) Consider the following plot ....
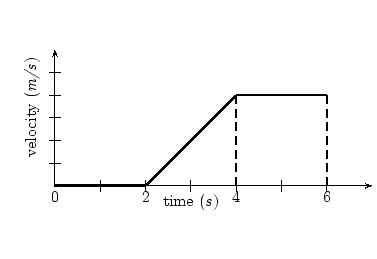
- Write a brief verbal description of what the object is doing.
- Is this object ever sitting still? If so during what intervals or at what moments?
- When is it going "forward" (+) and when is it going "backwards" (-)
- What is the fastest it is going (calculate from plot)?
- Using the ideas of area that we discussed in class determine how far this object travelled during the interval from 4 s to 6 s
- Sketch the position vrs time plot that tells the same story. Assume the object was at +1 m when the time is started (t=0 s).
3) Consider the following plot ....
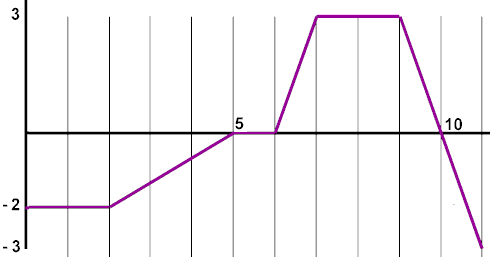
- Write a brief verbal description of what the object is doing.
- Is this object ever sitting still? If so during what intervals or at what moments?
- When is it going "forward" (+) and when is it going "backwards" (-)
- What is the fastest it is going (calculate from plot)?
- Sketch a velocity vrs time plot that tells the same story - does NOT need to be numerically exact!
4) Consider the following plot ....
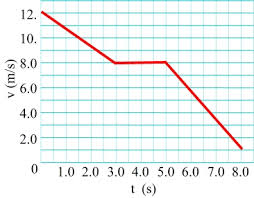
- Write a brief verbal description of what the object is doing.
- Is this object ever sitting still? If so during what intervals or at what moments?
- When is it going "forward" (+) and when is it going "backwards" (-)
- What is the fastest it is going (calculate from plot)?
- Using the ideas of area that we discussed in class determine how far this object travelled during the interval from 4 s to 6 s
- Sketch the position vrs time plot that tells the same story. Assume the object was at +1 m when the time is started (t=0 s).
5) Consider the following plot ....
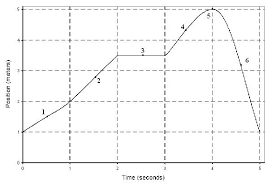
- Write a brief verbal description of what the object is doing.
- Is this object ever sitting still? If so during what intervals or at what moments?
- When is it going "forward" (+) and when is it going "backwards" (-)
6) Consider the following plot ....
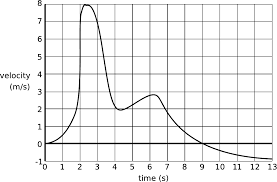
- Write a brief verbal description of what the object is doing.
- Is this object ever sitting still? If so during what intervals or at what moments?
- When is it going "forward" (+) and when is it going "backwards" (-)
