Spectra and Brightness:
There are the two topics embedded in this discussion. Emission and absorption spectra and what they can tell about gases in different places in the universe is the first topic. The brightness of objects and how it changes with distance is the second.
Light and Quantum Physics/Chemistry:
One of the great mysteries of the early part of the 20th century was the lack of a good explanation for why only certain colors of light were emitted or absobed by atoms of gas. We could describe these colors very accurately and each gas emitted light of very specific colors when it was heated. It had to wait until the development of quantum mechanics for a explanation to develop. One part of the quantum revolution, to which Albert Einstein contributed, is the idea that light is a mysterious thing that behaves like a wave sometimes but also behaves like a particle at other times. The conceptual challenge is to appreciate that light isn't either one of those things even though it sometimes looks like one or the other.
When light is displaying it's particle-ness the energy that the particle of light carries is dependent on it's color. The little 'chunks' of red light have less energy than 'chunks' of blue light. All red light with a wavelength of 600 nm is made of chunks of the same amount of energy. Atoms of any material can only give up or take in light where the size of the chunk exactly matches a gap in the energy structure of that atom.
Emission and Absorption:
A very hot atom has lots of extra energy (because we heated it up) and it is able to release energy by letting little chunks of energy escape in the form of light. Because of the quantum effects the colors of those chunks are unique to that atom. The pattern of colors that we see is called an emission spectrum (spectra is the plural). Below are emission spectra for hydrogen and sodium (thank to NASA for the images). Emission spectra are often referred to a bright line spectra for, perhaps, obvious reasons.
![]()
![]()
Complicating things a bit is the fact that the temperature of the gas changes the availability of different energy gaps in the atoms. This is perhaps not surprising but does complicate things a little. The following spectra are all bright line spectra for a gas of Calcium but at different temperatures.
![]()
![]()
![]()
Remember that blue light has larger energy chunks than red light. Can you see that the lower energy red and yellow light goes away and higher energy blue lines show up more as the spectra progress from top to bottom. Which do you think is the spectrum of the hottest gas and which is the coolest gas?
(top to bottom is cooler to hottest!)
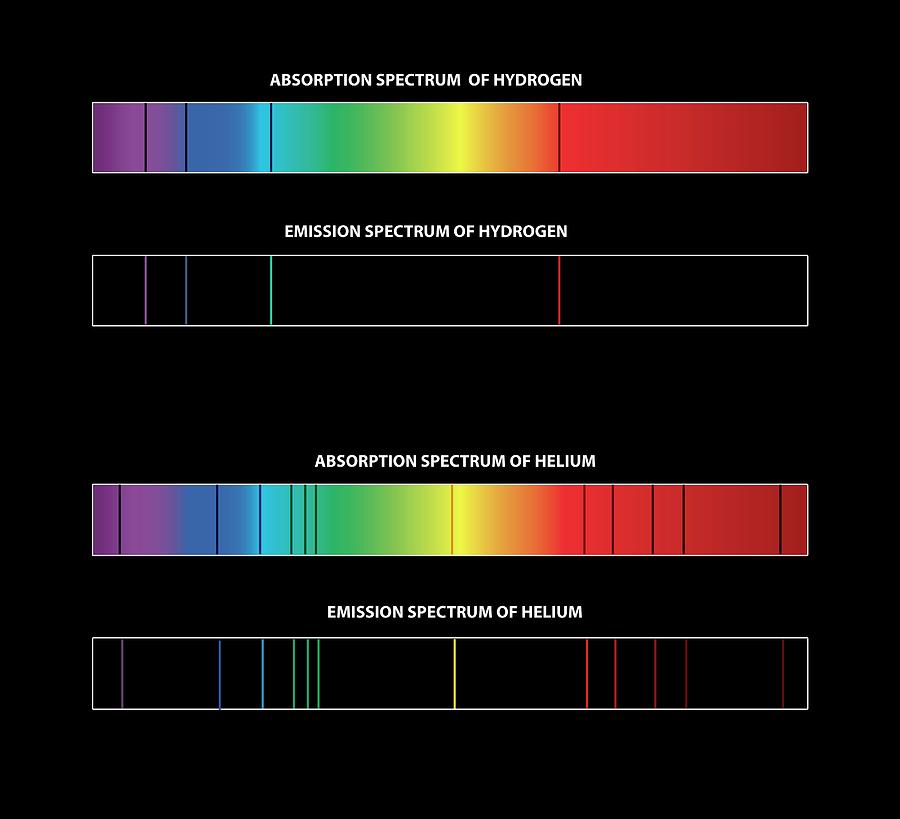
The other side of this same coin is that when many colors of light pass through a gas of a particular material the gas absorbs exactly the same colors that it would emit if it were hot. White light passing through a gas of hydrogen has dark lines (missing light) where they would have been bright coming from hot hydrogen.
Mixed Materials:
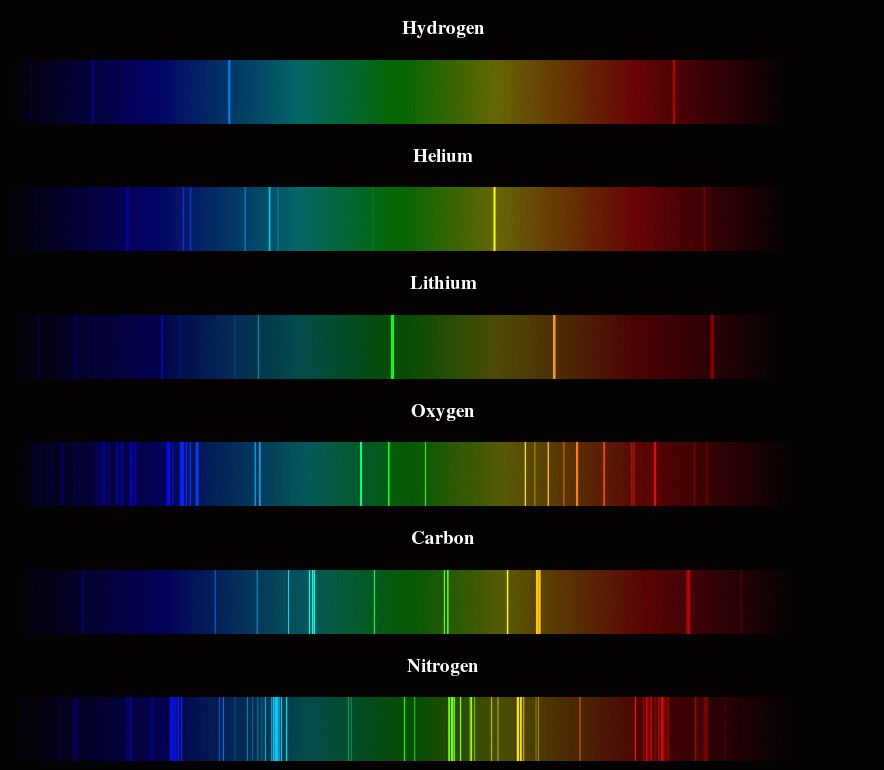
When a gas is made of a mixture of different elements or molecules the lines (bright or dark) will be stacked together to form a more complex spectrum. By looking at the location of the lines and their relative intensity we can deduce both which elements are present and their relative proportions. We can even use this technique to gather information about the atmospheres of other planets even, under the right circumstances, those that orbit other stars.
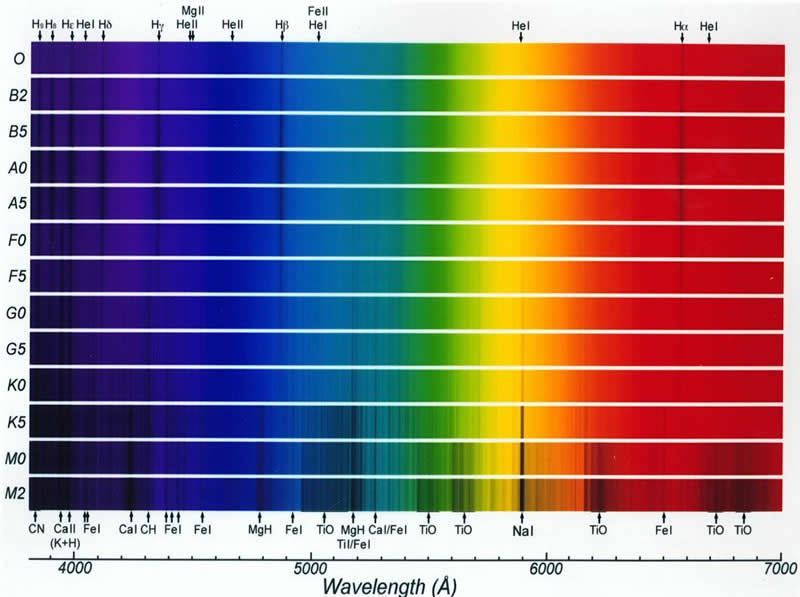
Activity: Below you will find a set of emission spectra for different elements. Below that you will find a set of absoption spectra from a range of different stars. What do you notice about how the elements in the stars changes from the top spectrum to the bottom?
HW: Spectra
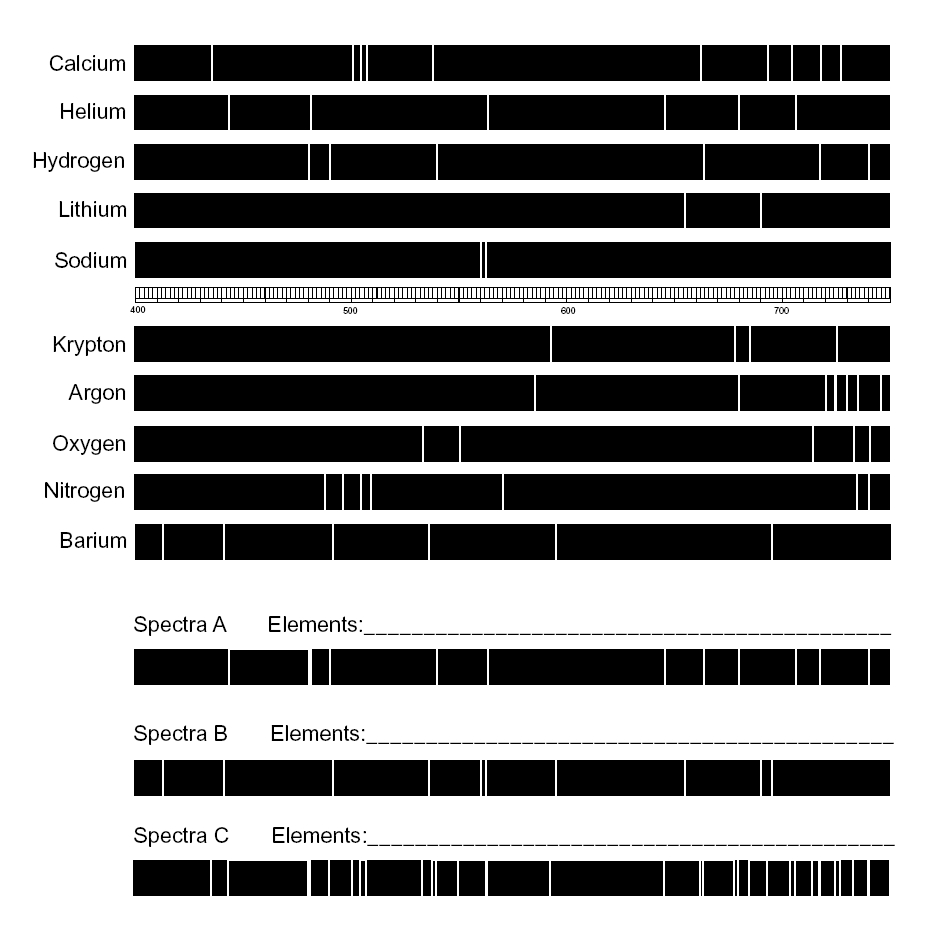
1 (A), 2 (B), 3 (C): The following images shows the emission spectra for a number of elements and three unknown spectra. For each of the unknown spectra identify two or more elements that appear to be present. Describe the particular emission lines that convinced you of the presence of each element.
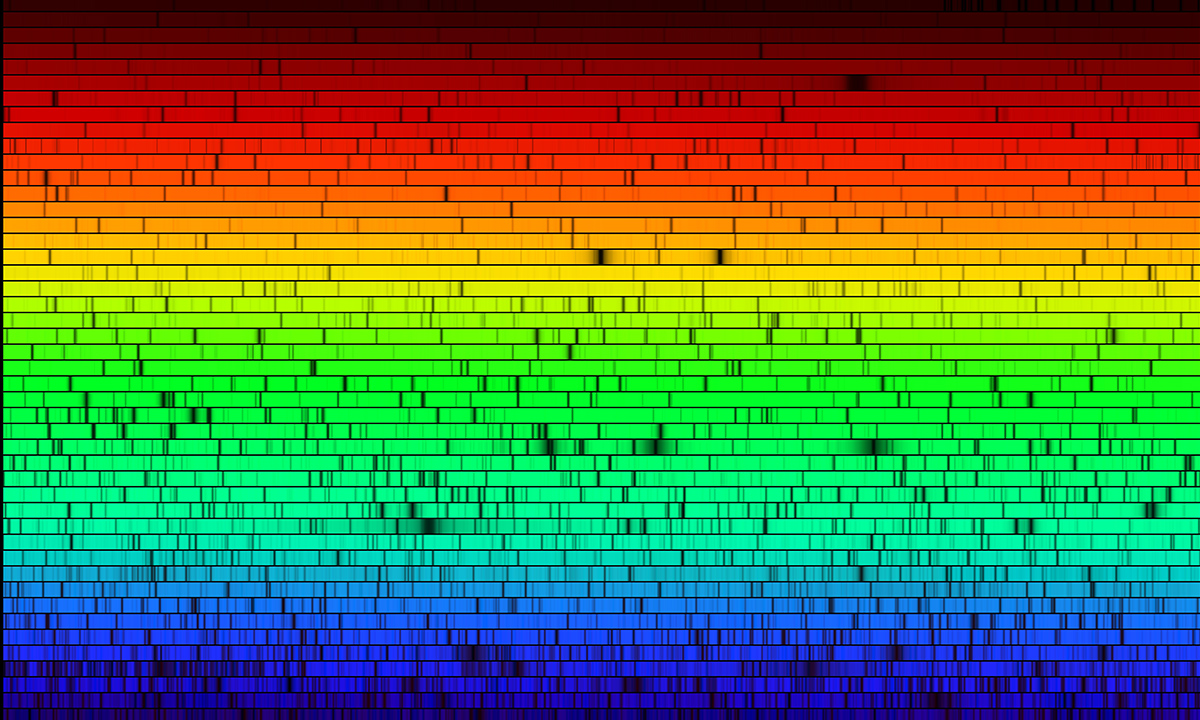
This does raise some questions about why the sun emits a continuous spectrum (what we see in a rainbow or a prism) if it is mostly made of Hydrogen which generally emits only the colors you see above in the emission spectrum. This is a very deep rabbit hole and I only want to go a little way down the hole. Any collection of many hot atoms produces light at many wavelengths in a predictable continuous spectrum called blackbody radiation. What the sun produces is a combination of emission spectra and blackbody radiation that is further complicated by the fact that everything is so hot many, if not most, of the atoms have been ionized (lost their electrons) and therefore don't produce emission spectra in the same way. Here is what the sun looks like when observed at particular wavelengths of light at ridiculous resolution (each line is just part of the spectrum) but you can see all the dark lines. Under normal circumstances it's all too bright and it just looks continuous.
Spectral Intensity Plots:
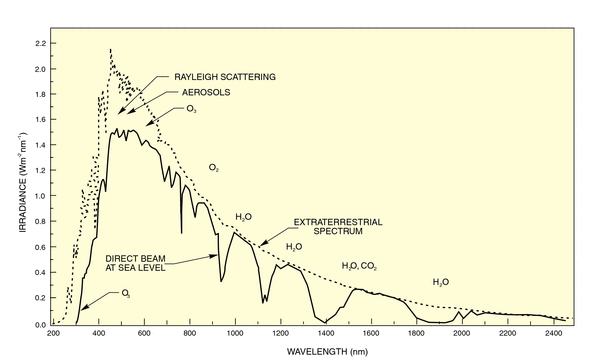
These plots are conveying the same information as the absorption spectra above but display it in a different way. This exampe looks at the wavelengths of sunlight that make it to the ground. The dotted line is the light that arrives at the top of the atmosphere. The solid line is what makes it to the ground. What does a dark band look like in this sort of data? The dark bands are wider than the dark lines we saw earlier because molecules like CO2 have more complex energy structures which lead to more wavelengths of light being absorbed.
Here is another version of the same kind of plot showing the intensity spectrum for a nearby star.
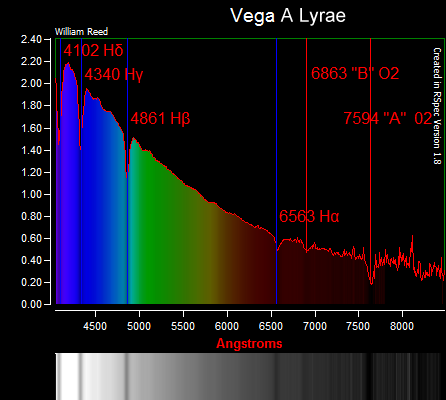
Activity: The plot above describes the wavelengths in Å (Angstroms) where 10 Å is 1 nm. What are the wavelengths of the 'dark lines' in nm. Which of the dark lines are in the visible range, infrared, and UV?
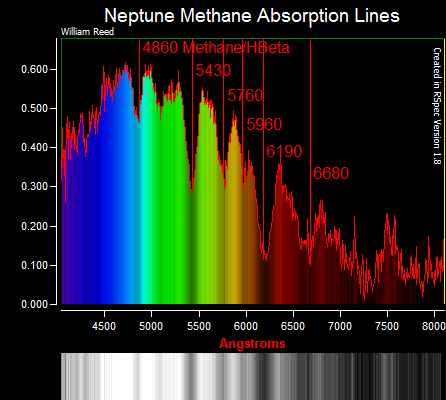
... and the atmosphere of Neptune.....
 ..
..
HW: Spectra
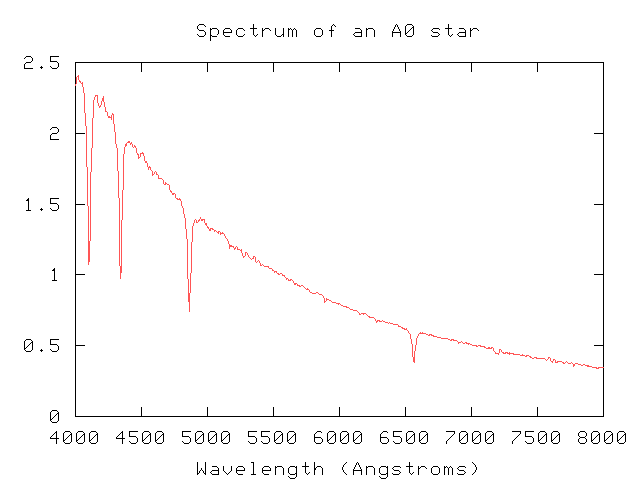
In the following spectrum of light (displayed as intensity relative to wavelength) there are 4 'dark' lines where significantly less light is seen. What are the wavelengths of those 4 dark bands. Convert Angstroms to nm and tell me, for each one, if the dark line is visible light (roughly what color), infrared, or ultraviolet.
Take Home: Spectra
Bright and dark lines in the spectra coming from stars and other objects can tell us about the specific composition of the matter emitting or absorbing the light. Specific wavelengths/frequencies are always associated with particular matter at a specific temperature.
Brightness:
Another important feature of light that we see is the brightness of the source of that light. In astronomy most of those sources of light are stars of one sort or another. We are quite aware that stars appear to have different brightnesses when we look up at the night sky but its not clear exactly what that means about the actual brightness of the star which produces that light. There are three terms we need to understand to sort this all out. The terms are apparent magnitude, absolute magnitude, and luminosity.
Luminosity: This is how much energy the star is putting out. A useful way to think about this is that this is the 'wattage' of the star. At some point during this term we will figure out the 'wattage' of our sun. There are a variety of units for luminosity which we will worry about later. There are big hot stars which produce tremendous amounts of energy and small cold stars which do not. Remember our earlier discussion about spectra and note that hot stars produce (generally) more energy AND it has a different blackbody spectrum that is stronger at the blue end of the spectrum. What is a general statement you might make about red stars?
What would make a two stars which are same luminosity appear to be different brightness?
Magnitude (apparent and absolute):
Apparent magnitude: A couple of thousand years ago a Greek scientist (Hipparchus) classified the apparent brightness of stars into 6 classes from brightest to barely visible. Much later, when we could actually make more careful measurements, this scale was kept but made more concrete. Essentially brightness is a measure of how much light intensity gets to us. It is a little complicated because our eye doesn't see brightness in a linear way. In rough terms a magnitude 2 star is 2.5 times (2.512 if you want to be fussy) as bright as a magnitude 3 star. This means a magnitude 4 star which might appear to be a factor of 2 different from a magnitude 2 star is actually more than 6 times dimmer in terms of actual energy coming to your eye (never mind that the scale goes the wrong way - dimmer stars have bigger magnitudes!)
Eventually we had to pick a standard reference point for the apparent magnitude. At this time we use the star called Vega as the reference point for an apparent magnitude of 0.0 (remember smaller numbers are brighter!) There are stars that are brighter than Vega which seems problematic unless you imagine that negative magnitudes are even brighter than 0.0. The brightest star in the sky is Sirius which has a magnitude of -1.0. The full moon, on this scale, has a magnitude of almost -13 (-12.7).
As you have figured out, how bright the star appears depends on several factors and is not a reliable indicator of how big or hot it is. As you will see in the HW problem it is challenging to identify how bright stars are relative to each other.
Absolute magnitude: Absolute magnitude is a statement about how bright the star would look if it were 32.6 lt-yrs (10 parsecs which we will define later) away from us. This allows us to understand which stars are actually brighter than others although generally we make these comparisons using luminosity rather than absolute magnitude.
Geometry - 1/r2:
A really important feature about brightness is that it diminishes in a very predicatable way due to distance. Imagine a giant sphere wrapped around the sun with the sun at the very center. The light hitting the inside of the sphere would be the same everywhere which is a statement about the energy density (energy/area) of the light. All of the energy emitted by the sun would be spread uniformly over the inside of the sphere. The radius of the sphere is how far away from the sun the observer is.
Now make the sphere 2x as big which means the radius of the sphere is 2x as big. Because the area of the sphere is given by 4πr2 the area increases by a factor of 4! This means the energy density (energy/area) hitting the inside of the sphere is 4 times less not just half. If you look at the math this is due to the r2 term. The light from a star 2x as far away is 4x less intense, all other things being equal, when we look at it and a star 10x as far away is 100x as intense. This is called the 1/r2 rule.
This also applies to lights around the neighborhood. Lights that are 2x further away appear 4x dimmer which is a good thing.
'Dark Sky' Ordinance:
This is probably a good point to note that, because we live in rural part of the country where we enjoy being about to see the beauty of the night sky, Deschutes County has adopted a lighting ordinance to help insure that we all get to enjoy the night sky. Even though your neighbor's outdoor lights get dimmer with distance they can still be bright enough to affect your ability to see the stars. This document provides information about this lighting ordinance. In brief what it says is that any outdoor light you install on hour property should not permit any light to leave your property. This means that no one off your property should be able to see the actual light bulb. Many people are not aware of this ordinance which applies to outdoor farm lights as well. If you decide to have a conversation with a neighbor about their lights please assume that they didn't know about the ordinance or the impact of their light on your enjoyment of the night sky. The ordinance applies to all lights installed or replace since 1994.
Lasers:
I should point out that the 1/r2 rule does NOT apply to lasers which is why we need to be careful with lasers. The light from a laser is NOT spreading out in all directions like the sun. Because of the technology of lasers it is hardly spreading out at all. If you were to look at a laser up close (DON'T!) it would seem just as bright as if you looked at the laser from 100 m away. This is why we don't mess around with lasers even at a distance:). To be sure the reality is that a laser does spread out a tiny bit and get dimmer but very very slowly which is why we can bounce a laser off the moon to measure the distance and still detect the light when it returns to the earth.
Take Home: Brightness
Brightness depends on both the 'wattage' of the source and our distance from it (1/r2 rule). Apparent magnitude is how stars appear to us here on earth and is NOT a good indicator of their intrinsic brightness. Apparent magnitude is NOT a linear scale - Mag 2 stars are NOT 2x as bright as Mag 4 stars.
HW: Spectra
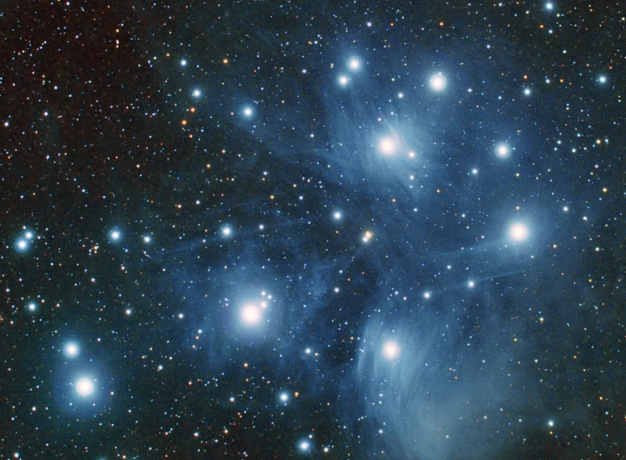
This image of the Pleiades has a range of apparent magnitudes. Figure out what you think the order of brightness is for the 9 brightest stars in the image and match them to this list from Wikipedia. How did you do? Apparent brightness is not easy as I hope you found.
Assignment: HW Spectra
Complete and assemble your solutions to all (3) of the HW problems listed here. Scan to a pdf and turn in on LMS. Please review HW format expectations for guidance about your homework solutions.
Reading Ahead:
Next time we will begin our explorations of the earth-moon system on the Sun, Earth, Moon breadcrumb. This will get us started in the exploration of how these three astronomical objects which are most central to our lives relate to each other.
