Context:
This is a very complex topic so my purpose here is to provide as much context for the standard model of stellar evolution as possible without asking to remember details. The overall picture of how stars form and live their lives is pretty accessible, though not simple, and it's the concepts I'm worried about.
A good starting place:
They Might Be Giants have sone called "Why Does the Sun Shine" which actually does a pretty good job of explaining our current understanding of the process. You can listen to it on Vimeo here. These are the lyrics.
Why Does the Sun Shine? (The Sun Is a Mass of Incandescent Gas)
The sun is mass of incandescent gas, a gigantic nuclear furnace
Where hydrogen is built into helium at a temperature of millions of degrees
Yo ho it's hot, the sun is not a place where we could live
But here on earth there'd be no life without the light it gives
We need its light, we need its heat, we need its energy
Without the sun, without a doubt, there'd be no you and me
The sun is mass of incandescent gas, a gigantic nuclear furnace
Where hydrogen is built into helium at a temperature of millions of degrees
The sun is hot
It is so hot that everything on it is a gas
Iron, copper, aluminum and many others
The sun is large
If the sun were hollow, a million earths could fit inside
And yet the sun is still only a middle-sized star
The sun is far away
About 93, 000, 000 miles away, and that's why it looks so small
And even when it's out of sight, the sun shines night and day
The sun gives heat, the sun gives light, the sunlight that we see
The sunlight comes from our own sun's atomic energy
Scientists have found that the sun is a huge atom-smashing machine
The heat and light of the sun come from the nuclear reactions
Of hydrogen, carbon, nitrogen and helium
The sun is mass of incandescent gas, a gigantic nuclear furnace
Where hydrogen is built into helium at a temperature of millions of degrees
Songwriters: Hy Zaret / Lou Singer
Why Does the Sun Shine? (The Sun Is a Mass of Incandescent Gas) lyrics © Helene Blue Musique Ltd
Actually all quite correct as far as we know.
Getting a little more into the data:
Organizing What We See:
When we look out at the universe all we can do for starters is organize what we see in different ways. As we have seen in labs a typical process in science is to see if there are patterns in what we are observing. The existence of a pattern suggests that there may be an explanation. The absence of a pattern suggests that a process is random. When we look at a group of stars we can try and organize those stars according to what we know about them and see if there are patterns. The easiest features of stars to use in our search for patterns are their brightness and their colors. Colors are related to temperature and brightness is related to energy. Consider this image of a group of stars where the colors have been slightly enhanced so we can see them better. What sort of pattern might you expect from these stars?
When we look more generally at stars everywhere in the sky and plot each star based on it's color and fundamental brightness we get a plot called a Hertzsprung - Russell Diagram (HR Diagram) that looks like the image shown below. It is important to recognize that many of the labels on this diagram have been added over the years as we have gained insight into the patterns that we see. Initially all we had was brightness and color.
Notice that there does seem to be some sort of a pattern. The band of stars running diagonally from top left to bottom right and a number of groups of stars in the top right and lower left. Lots of empty space. It is important to remember that everything we see out there represents a snapshot of the universe out there at this moment in time.
Notes on the HR Diagram:
Spectral Class:
Across the bottom of the graph we plot the composition of the star as indicated by the dark lines in it's spectrum. We looked at this in the breadcrumbs for light where the actual spectra for each of these groups is shown. From a general perspective the O type stars are very hydrogen rich and as we move to the right along the graph we see increasing amounts of helium starting around the G type stars and even heavier atoms as we get to the M type stars.
Temperature:
We can determine the temperature of the star by looking at how much energy is emitted at different colors and applying our knowledge of blackbody radiation (look back in the Light sections for reminders). What we see is that O type stars are the hottest stars and the M type stars are the coolest. This aligns with our understanding the hotter objects appear bluer than cooler objects which are yellow and then red (the M stars are very dim red).
Absolute Magnitude/Luminosity
As we talked about in a previous discussion Absolute Magnitude is a measure of how bright a star would be if it were at a specific distance from us. This is a way of accounting for the effect of distance which distorts our perception of how bright a star is. Luminosity tells us the 'wattage' of a particular star which is to say how much energy it is putting out. Absolute Magnitude and Luminosity tell us very similar things about the energy being consumed and released by the star.
Beginings of Understanding:
To begin to understand why this pattern of brightness and color exists we have to have some sense of how stars form. The pattern of the HR diagram became apparent as we developed the tools for determining the spectra of stars and their temperatures in the late 19th and early 20th century. Because of the spectra we knew that stars were mostly fromed from hydrogen. This is about the same time that we were beginning to have some understanding of nuclear processes. Nuclear fusion was understood as a possible process for generating loads of energy from hydrogen. Here are the basic concepts. In some part of a large cloud of hydrogen gas there is some lumpiness that draws more gas in due to gravity. As that gas falls inward it heats up and moves faster (hot atoms move faster). The protons that make up the hydrogen repel each other and rattle around at ever increasing speeds. You would expect this hot mass of hydrogen to glow like a neon tube but not as bright as a star. If enough hydrogen gathers together it will eventually get hot enough that sometimes the protons will be moving at each other so fast that they collide and fuse together (called nuclear fusion). This process releases large amounts of energy which tries to push all the gas away. Now we have two competing processes. Gravity pulling the gas inwards and compressing it and nuclear fusion releasing energy trying to drive it all apart. In our early calculations it became apparent that by the time the mass of gas was big enough and hot enough to start releasing energy through fusion gravity would be the dominant force. Depending on how much hydrogen was in the initial cloud of gas we would get a small star or a large star. Large stars are squeezed together more making them hotter and faster burning while small stars are cooler and slower burning. Here is a nice Veritasium video outlining the basic process. Please note how uncertain many of the folks Derek interviews are about the process.
All of this suggests that hot bright stars are very massive and burn quickly. Smaller stars are cooler and dimmer and burn more slowly. This gives us a rough explanation for the diagonal pattern through the HR diagram from top left (hot and bright) to the bottom right (dim and cool). This portion of the HR diagram is labeled the Main Sequence because of our expectation that it represents the characteristics of the formation of larger and smaller stars. None of this explains the stars we see at the upper right and lower left of the diagram.
This video gives a broad overview of the formation process for a star as we currently understand it. Notice in particular the competition between heat driving material away from the proto-star and gravity drawing in every more material which accelerates the heating.
This video shows how we use modern computational tools to test our models for how a star might form.
This basic model also leads to an interesting conclusion about the probable lifetimes of stars on the HR Diagram. A thing you know about campfires is that a big hot campfire consumes dramatically more fuel than a small warm campfire. The same concept applies to stars. The large hot stars consume the fuel (hydrogen) at a much higher rate than cooler stars. Given that the amount of fuel is limited by the size of the star this leads to an expectation that the large hot stars will burn out much faster than the smaller cooler stars.
Here is a modern verison of the HR Diagram with the information added that reflects our understanding about the masses and lifetimesof the stars along the main sequence.

By ESO - https://www.eso.org/public/images/eso0728c/, CC BY 4.0, https://commons.wikimedia.org/w/index.php?curid=19915788
Star Clusters:
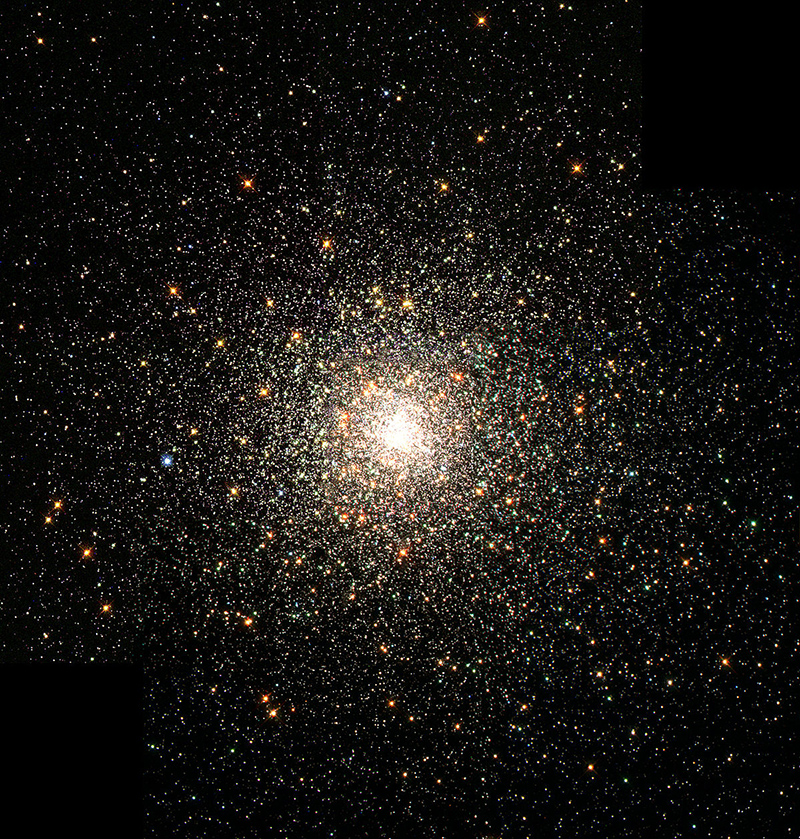
Stars are unlikely to form in isolation. A large region of gas and 'dust' is likely to have many lumps of many sizes that will lead to the formation of a group of stars at about the same time. Our current models would lead us to expect that stars from a recently formed cluster of stars would plot along the main sequence of the HR Diagram. Here is a Hubble image from a young star cluster.

Credit to NASA
Here are some HR diagrams for similar young star clusters. You will notice that they fall very much along the main sequence. The offset between the two plots is because the brightness hasn't been corrected for distance.
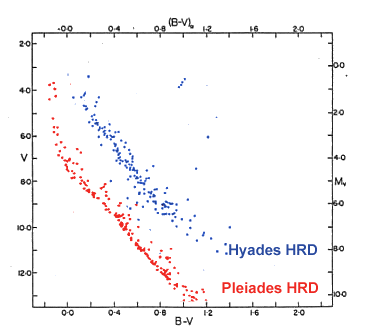
Credit to the European Southern Observatory
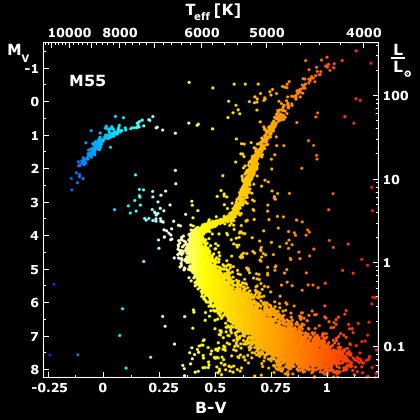
What about other HR Diagrams?
The previous HR Diagrams connect well with our models but then when we look at the HR Diagrams for some other star groups things seem different. In these HR Diagrams the large, hot, blue stars seem to be missing. Because we expect the large, hot, blue stars to have the shortest lifetimes perhaps this is an indication that this group of stars is older? In addition it also suggests that the stars above and to the right of the main sequence are large, hot, blue stars that have evolved to be cooler though nearly as bright. Looking at data like this is what eventually taught us that the giants and super giants on the HR Diagram are stars that evolved from the large, hot, blue stars and indicate that the group of stars is older.
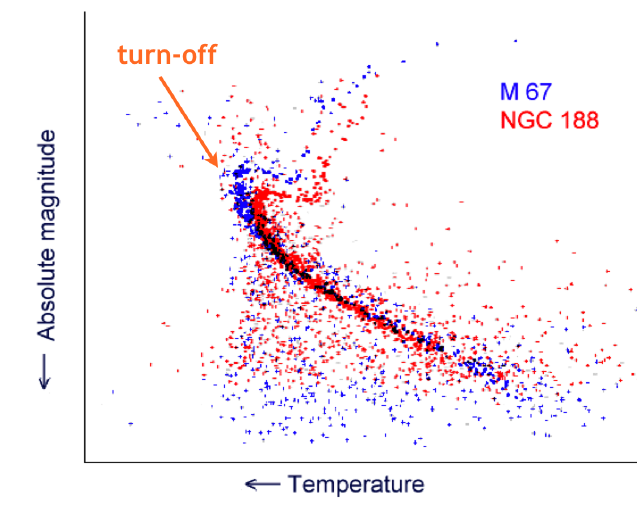
The further down the main sequence that the stars appear to 'turn off' the older the cluster is. In the example below this very old cluster also shows evidence that the giants and super giants may evolve back towards the main sequence creating a new group of large hot blue stars that are much older. We can actually detect additional differences from the spectra for these stars which have more heavy elements in them.
Here's a great video animation of that illustrates the process of generating the HR Diagram shown above.
An important conceptual understanding about the HR Diagram is that it shows stars as they are now and the pattern is not a representation of the path they travel through the HR diagram as they evolve and age. Our current models for how stars age has them spending most of their lives at a point along the main sequence and then moving off the main sequence relatively rapidly as they reach the end of their lives.
HW: HR Diagram
Here are 3 H-R Diagrams for different groups of stars (I, II, III). Which do you think is the youngest cluster of stars and which is the oldest? Explain your reasoning.
 |
 |
 |
Evolution of Stars on the HR Diagram:
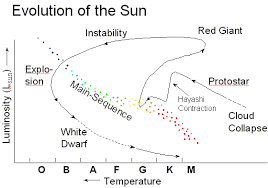
Here are some the paths for stars of particular masses as they reach the end of their life cycles. Compared to the time they spend on the main sequence the time spent on these last evolutionary stages is quite short which is why we don't see stars in the gaps on the HR Diagram.

Astronomers don't often pursue the task of laying out the entire evolutionary path of a star on the HR diagram but I was able to find this general illustration of the path of our sun through the HR Diagram. We have a fairly significant stake in this outcome so it seemed worth putting it out there. A really important thing to note though is that there is no timescale on this path. Here are some notes on that. It takes 50 million years or so to get from a baby sun to the main sequence. The sun will spend about 10 billion years sitting on the main sequence. This is thousands of times longer than it took to get to the main sequence. Once our sun gets to the end of its' cycle and starts to leave the main sequence it will move rapidly through the red giant phase for around 100 million years and then collapse into a white dwarf over 20 million years and then glow dimly for some very long period of time.
Before they get to the main sequence:
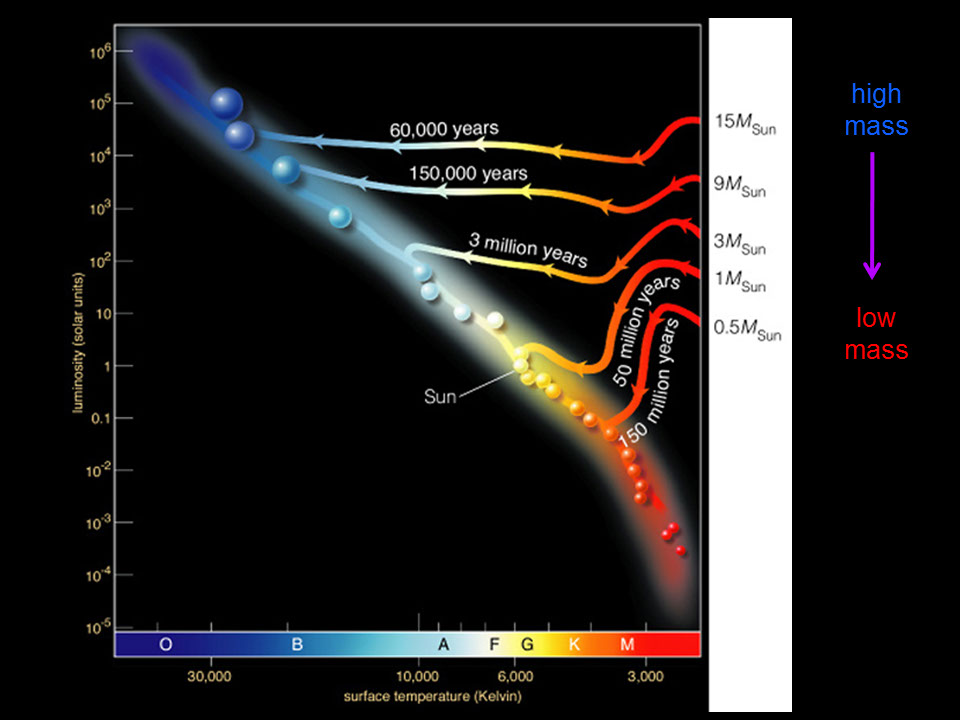
We also have models for how a baby star evolves from it's first moment of ignition until it settles onto the main sequence for the bulk of it's life. We have some evidence from recent observations to support these models.
At high masses the track to the main sequence may only take 60,000 years. At the low mass end we expect 50-100 million years. These are very short times in the life cycle of a star even though they seem long to us as humans. Remember that we think the dinosaurs ruled the earth for 270 million years so these proto-star timelines are not really that long. Crazy I know.....
Possible End Points for Stars:
As you've probably realized the ultimate fate or evolution of a star seems to depend on a range of factors though mostly on it's mass. This graphic will give you a sense of our current understanding about the possibilities. Notice that only some stars end their lives in super novas and only some of those lead to black holes. It's pretty complex but very interesting.
 ..
..
HW: HR Diagram
Download and print the following image of a blank HR Diagram. Answer the 7 questions below using labels on the diagram and by sketching on the diagram.
![]()
1: Which part of the H-R diagram is called the Main Sequence? Describe or indicate on the diagram. Why is it called this?
2: Where would you expect to find our Sun on the HR diagram? Circle and label.
3: Where would you expect to find a star that is much smaller than our Sun? What color do you expect this star to be?
4: Where do you expect to find hot blue stars on the diagram? Do you expect them to be less or more massive than our Sun?
5: If you are comparing a star located at E with a star located at B which do you expect to live longer? Explain your reasoning.
6: A protostar is what we call a star in it's embryonic stage (hasn't lit up yet). Where would you expect a protostar for a heavy star to first be observed on the H-R diagram? Why?
7: Do all stars die by supernova? Which stars are most likely to suffer this fate? Is our sun one of them?
Stellar Nucleosynthesis:
A final note. As we discussed about the formation of the solar system one question is Where did all the stuff which is not hydrogen come from?. This is pretty critical to us since our world and all life on our planet is formed from stuff that is not hydrogen. Since it appears that our models for the creation and evolution of stars are a least headed in the right direction we have some models for where the 'not hydrogen' comes from. This is described as the process of stellar nucleosynthesis. This video goes over the many parts of the process and will give you a good sense of things (13 min). The big take away is that the only way we think that the heavy elements of which we are made could be present in our solar system is as the byproducts of a super nova. That is why it is both true and lovely to realize that we are made of the ashes of dead stars -- we are in fact stardust! It also means that many large stars must have died to sprinkle their ashes through the universe before a solar system like ours could be formed. This means it is critical that large stars (the only ones that go super nova) have short lifetimes or there would be little chance of our existence ..... hmmmmm.
.
<
HW: HR Diagram
We believe, as we will discuss in coming weeks, that in the begining of the universe there was only hydrogen from which all the first stars were formed. That would mean the first stars were formed only of hydrogen and the products of hydrogen fusion. Does it seem likely or plausible that there were any earthlike planets around these first stars? Explain your reasoning.
Assignment: HW: HR Diagram
Complete and assemble your solutions to all (3) the HW problems listed here. Scan to a pdf and turn in on LMS. Please review HW format expectations for guidance about your homework solutions.
Reading Ahead:
Next time we will continue our explorations of the solar system on the Galaxies I breadcrumb. This will support our discussion about the formation and evolution of the broader universe.
