Purpose:
The overt purpose of this lab is to actually generate and interpret an HR diagram for a particular star cluster. In this case the Jewel Box cluster in the southern hemishpere. As we have discussed in class the HR diagram is a snapshot of the evolutionary state of a group of stars. The covert purpose of this lab is to have you get some direct experience with developing the sort of data that is used to create an HR diagram. Even when we have more effective technological tools to generate the data scientists often evaluate the data by hand for a number of cycles until they feel like the understand the considerations in the data. The activities in this lab were developed by the National Optical Astronomy Observatory and are available to teachers everywhere on this site.
Procedure:
The general procedure is to identify and plot the temperature (color) and brightness of each star in the cluster. This creates an H-R diagram for the stars in the cluster which can be used to give us some sense of the age of the group of stars.
Independent Lab: If you are doing this lab independently you will need to print out the resources or work with resources on your screen. IF you choose to print out the resources I encourage you to print out the image of the Jewel Box Cluster on photo paper. I know the paper is more expensive but the quality of the color and size of the stars is much better on photo paper.
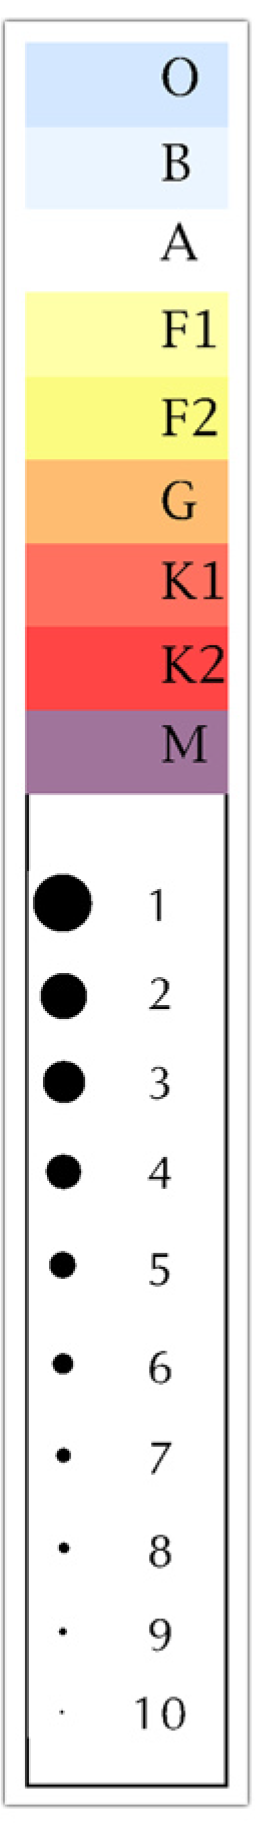
- Your group will be given a color print of the Jewel Box cluster (pdf of image) and a print of the reference scale (pdf of reference scale, png of the reference scale).
Commentary: If you are working independently you may wish to print out this pdf which has both the image of the Jewel Box cluster AND the reference scale on a single page. After printing it out you will want to cut the reference scale off of the end of the image.
- Within this image are stars that are part of the cluster as well as stars that are 'behind' or 'in front' of the cluster. These stars are called field stars. The main cluster is roughly within the red circle and the stars in the green circle are probably only field stars.
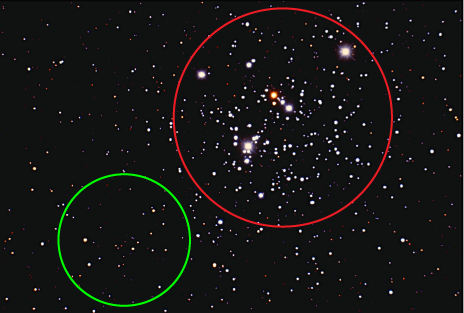
- You will then determine a region of the image that contains some of the cluster (a square 4-6 cm in size on the full size prints). Your region does NOT have to be as large as the red circle but should cover a reasonable amount of it. Each star in that region needs to have it's color and brightness determined and plotted on the HR graph worksheet (pdf here). You do NOT need to be tremendously precise in this determination. This is why the boxes in which to place the data on the worksheet are relatively large. As you determine the characteristics of each star plot it on the worksheet and then mark it out so you know it's been counter. To begin with have each member of the group identify the 5 brightest stars in the group. See if you agree about the color and brightness of those before starting on the rest.
Commentary: Begin by printing off the work sheet. The size of the star is plotted along the vertical axis and the color of the star is plotted along the horizontal axis. The color of the star is most evident on it's edges. In a f2f class I normally put the images in a plastic sleeve so it's easy to put a marker dot on top of stars that have been classified and counted. You can do this if you're working independently as well. If you are working digitally on a screen I am thinking that you can use the bottom of your window to slowly move up through the part of the image that you have boxed or circled trying not to lose track. Just give it your best effort. For those working on this digitally you will need to make sure the reference scale is the same height as the short side of the image or the size of the reference dots will not be correct.
- Continue until you have completed your plot. Post a scan of your HR plot in the discussion board on the LMS (this week) Compare the shape of your plot with another group or student and see if you have similar data. Compare your plot to the examples at the bottom of the worksheet. What does your data suggest about the age of the Jewel Box cluster? Be sure you can explain your reasoning.
- Using a different symbol or pen, plot the characteristics of a small region of field stars on the same worksheet with the stars in the cluster. Does this suggest a way to account for the field stars that were included in your cluster stars? Does it change your interpretation of the age of the cluster?
- The lab instructor will distribute images of a couple of other star clusters (cluster1, cluster2. What do you notice about the HR characteristics of these other clusters? Which one would you identify as younger and which as older? Explain clearly why.
LAB DELIVERABLES:
I) Present your HR diagram of the stars in the Jewel Box cluster. What does this data suggest about the age of the cluster relative to the examples. Clearly describe what features of your plot and the examples you are using to make this determination.
II) Discuss which stars in your original plot are most likely to be field stars and why.
III) Offer your analysis of the likely age of the two comparison clusters that are linked above. Are they younger, older, or about the same as the Jewel Box cluster. You will of course explain your reasoning.
