In the event that any external links are broken or outdated please let me know as soon as possible.
More Kinematics focused on graphing and math representations....
Consider the following setting....A bicyclist is riding along at a constant 8 m/s on the flat. 30 s later, after making the corner at the bottom of college way hill she is able to maintain a constant 4 m/s for 40 s.
Feel free to use graph paper for this next exercise. Make an position vrs time plot/graph of this motion. Label your plot clearly and in a way which is consistent with the description of the setting. Share with nearby colleagues and see if the plots look essentially the same. What is the shape of the plot at the point where the speed changes? Would the mathematicians call it discontinuous or not? Why? How do you make sure the slopes are correct?
Now... mark, on the plot, the location of the rider every 10 s. 'Project' that location onto the vertical axis and make a spot/box. What you have drawn along the position axis should be a reasonable motion diagram for the biker. Is it? If someone asked you to draw the position vector for the rider when t=20 s how would you draw it?
How would you express the function which describes where the rider is mathematically? What do you do about the change in speed?
Another rider who was initially at the same place as the first rider is able to maintain a constant speed of 6 m/s regardless of the terrain. How do you show this rider on your plot? Do the lines intersect? Where and why (what does this mean)? How would you solve this mathematically?
Redraw the plots as velocity (speed) - time plots. Compare with your neighbors and reconcile any differences. Where do the two riders meet on this plot and what does it look like?
Consider this graph:
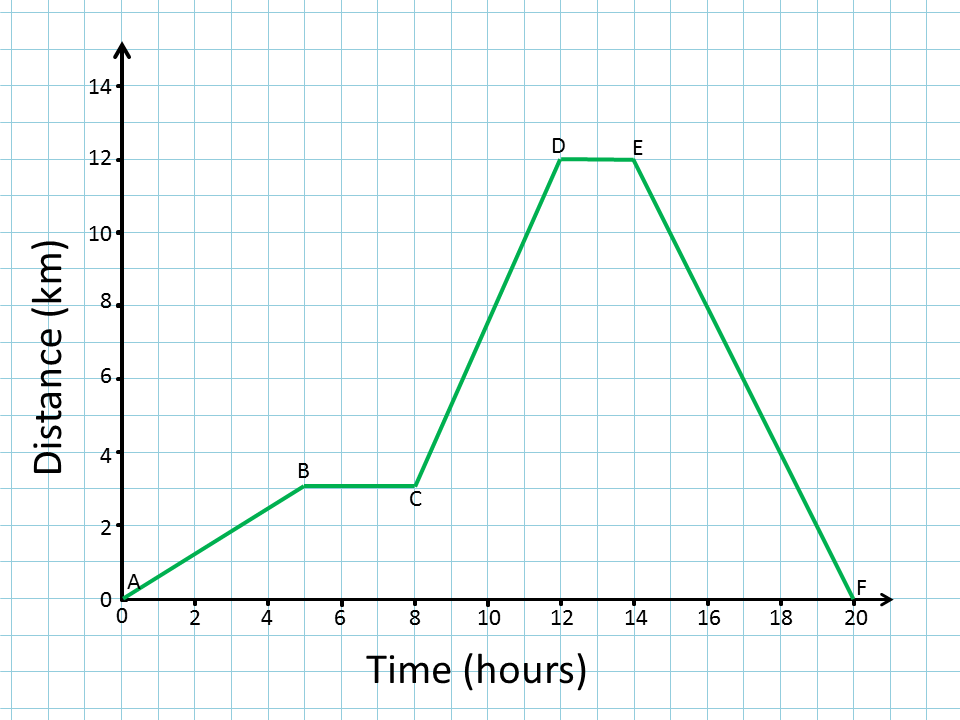
Describe the motion of this object to your tablemates....
When does the object get to 8 km? Fast is it going at 18 hrs? A speed turtle is travelling1 km/hr. Who wins the race to cover 10 km? Where did the object turn around? Where is it accelerating? What are the mathematical expressions that say the same thing?
Sketch the v vrs t plot for the same motion -- be sure that the two plots are consistent. What does the turtle look like on this plot? How do you answer the race question from this plot?
What if the plot is actually a v vrs t plot and the vertical axis is in km/hr. Now describe the motion of this nwe object. When does the object get to 8 km? How fast is it going at 18 hrs? Where did it turn around? Where is it accelerating? What are the mathematical descriptions of the different parts of this motion?
We should now have the following basic mathematical descriptions of specific features of these plots. It's fascinating to me that there are so many version of these on the web. This one matches most closely to my perspective...
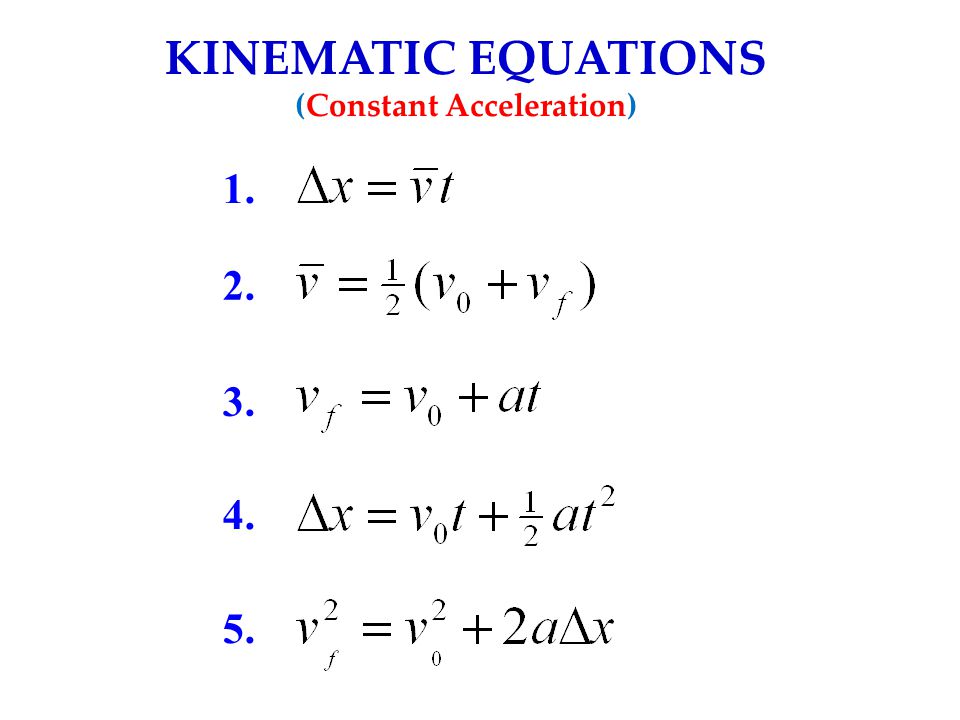
How would you know from a plot that these equations apply (only valid for constant a = acceleration)
Where is a portion of a graph which is decribed by #1. (this is just the old d = r*t that you may remember). Why the bar over the v?
Where is a portion of a graph which is decribed by #2. I would think of this more as the definition of average velocity when the acceleration is constant?
Where is a portion of a graph which is decribed by #3.
Where is a portion of a graph which is decribed by #4. What does this describe on the v vrs t plot? What does this look like on the x vrs t plot?
What the heck is #5?
I think of these as the 4 kinematic equations rather than 5 because #2 seems more like a definition to me. How would you interpret this list of kinematic equations?
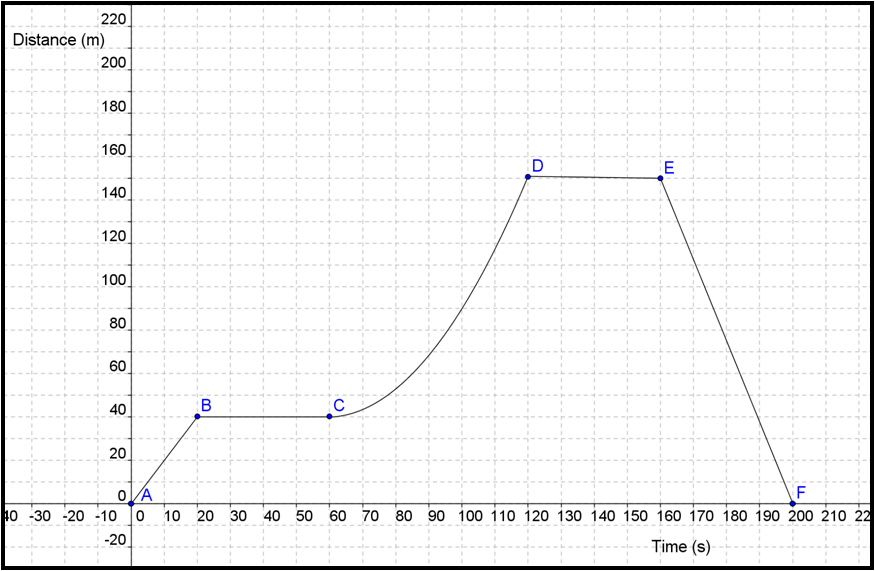
If you want some more practice with graphs....all the same questions as the previous graph
So now....how do we turn this into problem solving? Here's a fairly straightforward sounding problem. We'll use this problem solving frame for addressing the problem.
You want to throw a ball straight up into the air so that it reaches a height of 3.3 m above the ground. You may take it as a given that the acceleration of the ball is 10(m/s)/s downwards and constant.
How would you produce a plot of this motion? Would you use an x vrs t or v vrs t plot? Why? What can we say about this problem at this point?
Some more information....Assume the ball leaves your hand at a height of 1.2 m above the ground. Now what can we discover? What does this mean about features of the plot? Which kinematic equation is describing the same thing?
