Purpose:
The purpose of this lab is to explore the characteristics of individual data points. To do this we need to generate some data. Since we are trying to understand data characteristics it will be better if the data is not too precise. To this end you will be asked to determine the distance you travel when walking on a hard flat surface in 10 steps. We will divide that number by your height in meters. You could use this number in the future when you are working Sylvia Holmes (Sherlock's sister) on future criminal cases to determine the possible height of the unknown subject. Here is a Scientific American discussion of this human characteristic.
Procedure:
For this lab you will need paper and pencil to record raw data, access to a Jupyter notebook, and little else. As always in lab you will need your minds (or at least some significant portion of them). Reference notebooks for each lab can be accessed from this github site.
- 1) It would be ideal to divide the class into two groups that we might expect to generate different data. Alternatively we may decide to use our data to test the idea that there is no difference between the different groups. We will discuss possible divisions of the class data and reach a concensus.
- To generate your data point you need to measure the distance you cover in 10 steps, convert that measurement to meters, divide that by 10 to get the length of a single step, and divide again by your height in meters. We will call this the Height Ratio (HR) going forward. In a f2f class we will gather this data into 2 sets on the board in class and share it with the class. In remote land the data will be gathered an shared on a discussion board on Bb.
- 2) At this point we will explore the Jupyter notebook for this lab. The notebook will illustrate how to enter a data set. We will then use python tools to determine the mean, median, average, and standard deviation of the data. Finally, the notebook will illlustrate how to create a histogram of the data using matplolib plotting tools. We will only scratch the surface here but it will be a start.
- 3) In your lab notebook that you turn in you will use convenience of python to explore how different choices for the number of bins clarifies or obfuscates the meaning of your data. We will discuss this as a 'Goldilocks triplet' of histograms (too many bins, too few bins, and just right). Along the way it is expected that you will play with some of the characteristics of the histograms to personalize their look.
- 4) Finally, we will compare the histograms from the two groups and discuss how the data supports or doesn't, differences or similarities between the data the two groups. This replicates, the experience you will have in every lab where each group is ostensibly measuring the same effect and yet all the data is unlikely to be identical. Remember that, in the real world, what we are doing here applies to each individual data point that you take for a larger set of measurements that relate two or more variables.
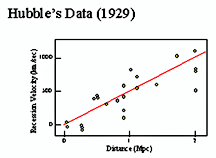
- Consider the two plots below. The data that is presented on the left shows the data points as if they were exact but in fact each one has some range of multiple measurements that is more honorably reflected in the right handversion of the same plot.
used with permission under NASA media guidelines |
Creative Commons CC-BY 3.0 : Wikipedia |
- CONCEPTS:
- Mean, median, min and max for a set of data
- conceptual understanding of standard deviation (σ) and its estimation
- how the standard deviation informs the analysis of different sets of data
LAB DELIVERABLES:
0) In the future this will be taken as a give but at the begining of your notebook create a title, then your name, then the date, and finally list your group members. Below these headers and information write a paragraph which describes your understanding of the purpose of this lab and how the data was collected. This should take a couple of real paragraphs and not just a couple of sentences. For every code cell that is requested below you will be expected to preceed it with a markdown cell explaining clearly what is happening in that code cell. These are general expectations for all of our lab reports going forward.
I) Following the introduction above ....
II) In the next ....
III) In your notebook present three histograms of your data (the 'Goldilocks triplet') In the markdown cell preceeding each plot create a suitable descriptive header and then explain the strengths and weaknesses of the particular histogram in conveying the distribution of the data.
IV) In a markdown cell describe clearly and completely how your calculated value of the standard deviation is consistent with a conceptual understanding of this statistical measure. If you told someone that the standard deviation of the data was 1.0 m how could they argue from your histogram that you can't possibly be right?
V) Based on your understanding of the meaning of the standard deviation is there a meaningful difference between the data from the two groups? Is there any level at which you can argue there may a difference between the different groups. Be careful to describe what the data says and not what you may or may not believe about the experiment.
Data/Meaning Rubric:

