Periodic Motion:
There are lots of physical systems which exhibit behavior which we might describe as periodic.....
Class Discussion of Examples:
things which repeat in some way - time, space, numerical? The ultimate test is whether the next occurance is predictable.
time - lunar cycles, pendula, engine pistons, generator coils rotating
spatial - seats in an auditorium, bricks in a wall, petals around the stem of a flower, Na atoms in NaCl xtal
numerical -- 1/n, fibonacci, sine(), cosine(), tangent()
Does it have to be exact repetition?
The daily cycle of the sun is periodic but not exactly due to seasonal variations. Does that mean we can't predict when it will rise and set 10 years from now?
A real pendulum slows down and doesn't come back to exactly the same place each time -- does that defeat the idea of periodic?
As we keep talking about in physics the first step is to consider an ideal periodic behavior and then try to understand how and why we need to correct it to create a better description of the real world. We can idealize a pendulum that doesn't die away. We can idealize/simplify the orbit of the earth and it's rotation so that the days are exact repetitions of each other for starters. This should seem very much the way science develops (and is connected to your lab projects as well).
Quasi-periodic:
When I set up folding chairs at an event -- I try to be periodic but it isn't perfect for sure.
When you arrive at your zoom class each week. Yes, you'll be there but the timing varies. Periodic with a little randomness thrown in.
First Steps:
Starting with a fairly well behaved periodic system...
Kinematics or Dynamics?
Remember (PH211) that Kinematics is our description of how something moves and Dynamics is the effort to explain why it moves that way. If we know it's position as a function of time we can differentiate to get v(t) and a(t) and the a(t) tells us what Fnet has to be. Dynamics starts with the forces which lead to a(t) and then we integrate to get x(t) which descibes how it moves. We are going to do both eventually but lets start with kinematics this time.
Activity: Do the following in your group or individually. This will take some time but is important practice applyingy
Sketch the cycle(s) of the pendulum.
Discuss and identify a reasonable choice of origin for describing the motion of the pendulum in x, y, and θ.
Discuss and estimate the min, max, or extremes, and neutral positions of the pendulum in x, y, and θ.
Discuss and estimate the velocity at the min, max, or extremes, and neutral positions of the pendulum in x, y, and θ. Is it clear where vmax is?
Where in the cycle is the velocity increasing (acceleration >0), decreasing (acceleration <0) or neither (acceleration = 0).
How long does it take for the cycle to repeat (could be called the period)? Is this cycle time consistent?
Results of Discussion:
(someday I will figure out how to hide this stuff until I want you to see it -- sheesh)
If we call the neutral position 0 for all of the variables the we would represent what we see something like this. You min/max/neutral may start at different points in the process but are likely to be similar.

Just looking at one of these (the horizontal - x ) it might look like this.
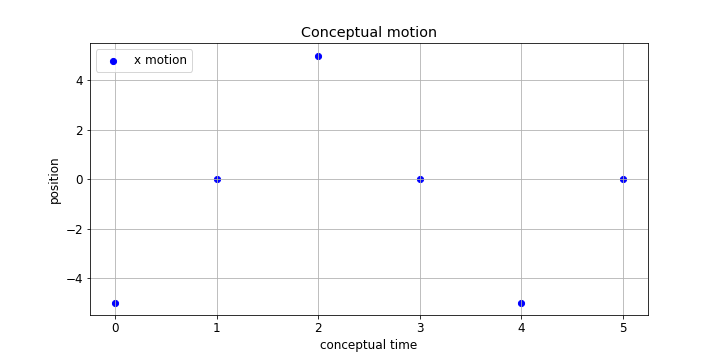
Then you were asked to consider the velocity at each of these points. From discussions in PH211 you would know to sketch these in as slopes at the various points although there are a range of possible ways it might look that are shown below....
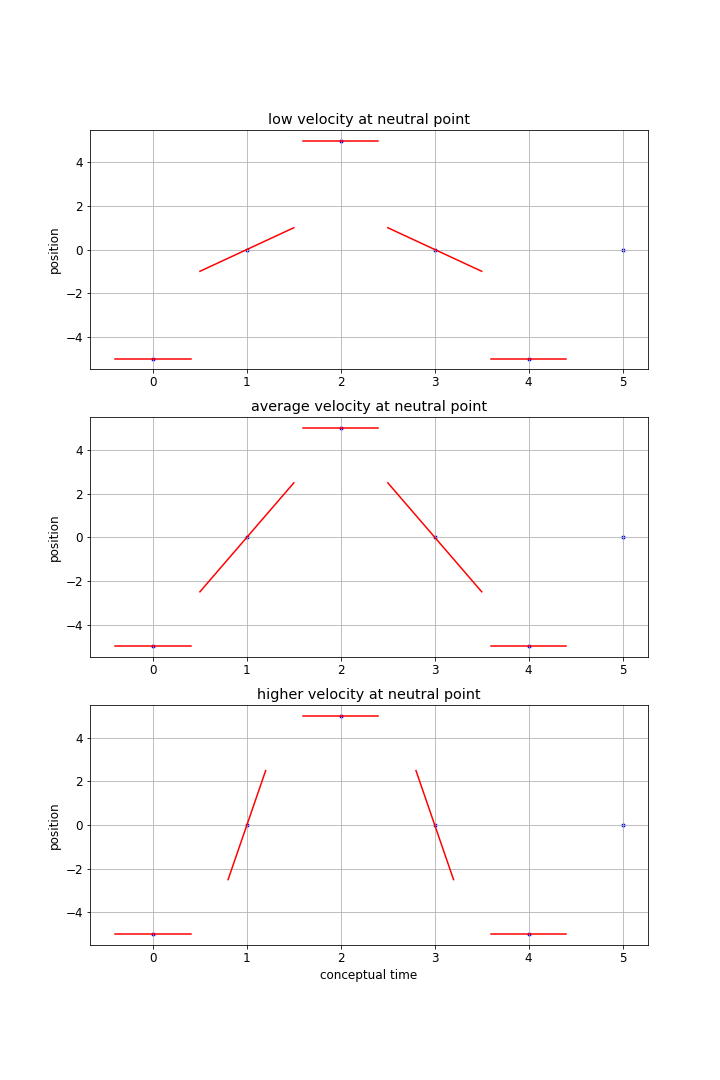
This is an important point to stop and think about what our past conceptual understanding tells us. If you look at the video you will no doubt notice that the velocity is highest at the 'center' and slows to a stop at the extremes. This means the slope of what ever function describes x(t) must have a slope that steadily decreases as the pendulum moves from the 'center' to the extreme AND at the same time must the tangent to the function along the way. Take some to be sure that you have an argument why the first two examples above are NOT consistent with those concepts.
This is a good point to think about what the actual times and distances are in the video clip. When I made a rough estimate I found a cycle time in the horizontal direction of 5-6 seconds and the total range of motion feels like it is between 2 and 3 m (not sure why I feel that way). Taking 6 seconds as a nice number that means each quarter of the cycle is 1.5 s. If I take the full range of motion to be 2.4 m then the pendulum moves 1.2 m each way from the 'neutral' position.
Adding these physical observations to the best conceptual model I get this graphical representation....
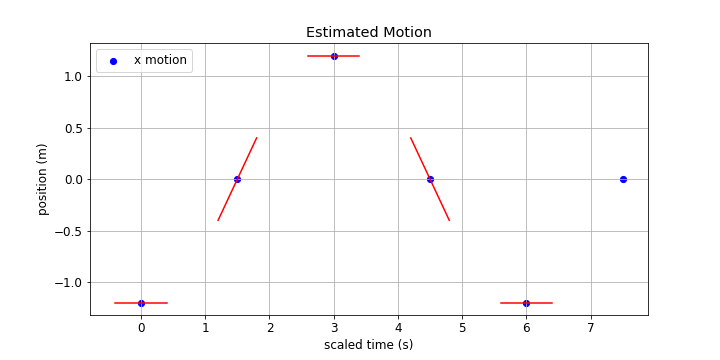
If we're looking for a mathematical description (a function) that has these features there a limited number of choices. The functions which repeat cyclicly for an indefinite length of time are the trigonometric fuctions and of those only sine(θ) and cosine(θ) don't have some form of asymptotic behavior which doesn't seem to be part of our observations at this point.
In looking at the particular conceptual sketch shown above you would associate this shape with -cos(θ) though your sketch might look more like sin(θ). Those differences are just about where you start the clock.
Amplitude:
The sin() and cos() functions only vary between 1 and -1 so I have to scale them by some value to get them to reach my labeled min and max. 2m * sin(θ) ranges between +2m and -2m so -1.2m * cos(θ) ranges from -1.2 m to +1.2 m. This value is known as the amplitude of the motion and is usually abbreviated A. Be conscious that A has units because trig functions don't. So now we have, for a trial function,
x(t) = -A cos(θ)
Time Dependence:
The position is clearly time dependent which raises the question of where the time dependence 'lives' in this expression. I trust you notice that it must be in the angular term. θ = θ(t). To make our mathematical description line up with the times on our plot we have to stretch or shrink the trig function horizontally. What we know is that when t = complete cycle = 6 s then we want the angle to be 2π which is a complete cycle of the sin() or cos() function. The time it takes to complete a cycle is so useful and common it has it's own name and symbol. The cycle time (or distance) is called the period and is indicated by the symbol T. Now we can propose a time dependent function for θ(t) that looks like this.....
θ(t) = (2π/T) t
Notice that because T has units of seconds and t has the same units that θ(t) is dimensionless which means it represents radians NOT degrees!
Period and Frequency:
Many forms of periodic behavior have periods that are human scale -- seconds, minutes, days etc. This makes the period (T) an interpretable number. Other forms of periodic motion have much shorter time scales which are often less conceptually accessible. A string could be vibrating with a period of T = 0.005 s/cycle which is the same as 200 cycles/sec. This quantity that is the inverse of the period is called the frequency and is defined as f = 1/T. The units of frequency are 1/s or s-1 (cycles isn't a unit) which is called a Hz (Hertz). 200 Hz = 200 s-1 which is equivalent to T = 0.005 s.
Note:
Please notice that the period for the vertical (y) part of the motion is NOT the same as that for the horizontal (x) part of the motion. It's half as long -- do you see it?
Putting It All Together:
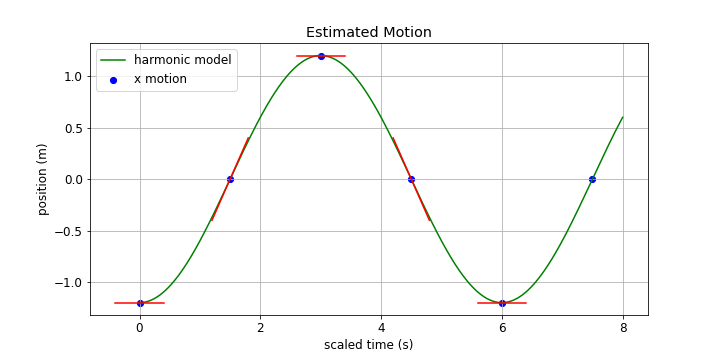
Our proposed function to describe our observation is...
x(t) = -A cos((2π/T) t)
...and it looks like this when it's plotted...
Periodic vrs Harmonic:
The sine and cosine are also known as harmonic functions (probably due to connections with music). If the motion of an object can be described accurately with sine or cosine it is said to be harmonic motion. All harmonic motion is periodic. NOT all periodic motion is harmonic! When we look at the differential equation that describes this motion we will understand more deeply why this motion of the pendulum is very nearly perfectly harmonic.
Now that we've thought about it and worked it to death what about this animation? The first animation and the second are different in an important way besides the animation technique. What is that difference and which one aligns better with our actual observations?
Activity: Consider the following plot of the motion of an object. Answer the following questions about it's behavior.
a) Is this motion periodic? What is the period if there is one?
b) Is this simple harmonic motion? Why or why not?
c) What is the amplitude of this motion? What is the frequency?
d) Sketch the velocity vrs time plot and determine the maximum velocity.
.
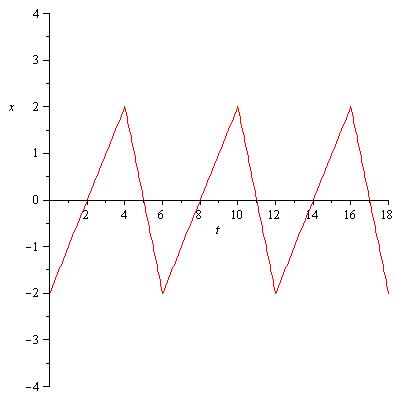
The following homework problem presents an interesting situation where the behavior is not symmetric around 0. Think about how you would adjust a symmetric function to accomodate this.
HW: Periodic

a) Is this motion periodic? What is the period if there is one?
b) Is this simple harmonic motion? Why or why not?
c) What is the amplitude of this motion? What is the frequency?
d) Sketch the velocity vrs time plot and determine the maximum velocity.
HW: Periodic
Consider this sunspot data. While it may not be perfectly periodic how would you best model it as periodic behavior? Think about what you have to do to deal with 0 sunspots NOT being the equilibrium state of the graph. You will need to decide when to set your time equal to zero. You will also need to make a decision about how to deal with the inconsistent "amplitude" of this periodic behavior. Do this both for the period from about 1880 - 1920 as well as the period from 1960 to the present. Are there differences and if so what are they? Exchange your model with a friend in the class (different person from problem 1) and use the new model to calculate the years of sunspot maxima between 2040 and 2060.
Velocity and Acceleration:
A important feature of being able to describe the position of an object as a function of time (kinematics) is that having done so we can now take derivatives to find the velocity and acceleration as a function of time. Starting with: (1)

..then velocity is the 1st derivative (chain rule)...(2)

...leading to....(3)

..and another derivative to get to accleration....(4)

...leading to....(5)
![]()
Equations (1), (3), and (5) are the critical ones to keep track of . They tell us that if we know A and T we can calculate vmax and amax from those simple observable features of the motion.
Here is what all of this looks like graphically. Use the values from the blue position function to calculate the amplitudes of the velocity and acceleration plots -- check that it makes sense!

Activity: The following video shows a hammer thrower in motion. The 'hammer' moves in a circular pattern. Pick a linear direction (left-right, forward-back, x, y) and determine A and T or f. From those values calculate vmax and amax. How fast does this mean the hammer is moving along the circle? Given that the hammer has a mass of 7.26 kg what is the tension in the cable? These last two parts require a clear understanding of the relationship between vmax , amax and the movement of the 'hammer'.
HW: Periodic
Write up and turn in your results from the analysis of the hammer thrower.
Assignment: HW: Periodic
Turn in the various (3) homework problems in this breadcrumb.
Assignment: Reading
Go on to Periodic Motion II breadcrumb to move to our discussion of the dynamics of periodic behavior.
